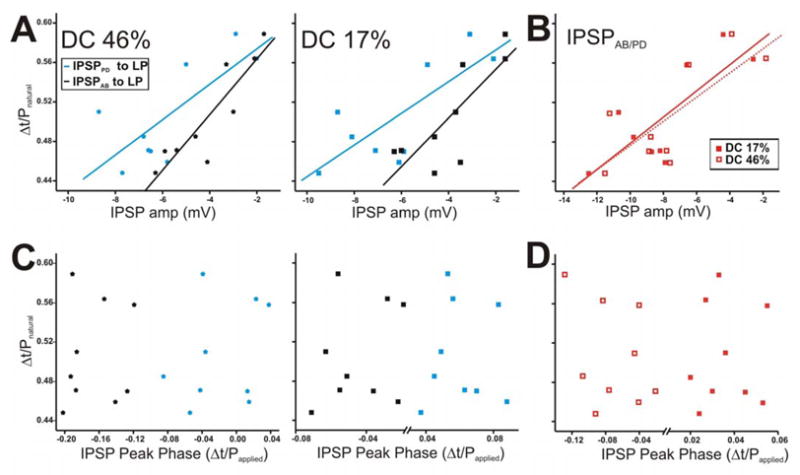
Figure 10.

The LP burst phase in the ongoing rhythm is positively correlated with the amplitude of the AB and PD synapses but not with their peak phase. The LP burst phase in the ongoing rhythm was measured using the natural pyloric period and the PD neuron as a reference point. The IPSP values chosen for this figure are those corresponding to cycle periodapplied of 1 s. Each point in the graph represents one preparation. A. The LP burst phase during the ongoing rhythm showed a strong positive correlation to the IPSP amplitudes due to AB and PD neurons, for both DC 46% (left panel) and 17% (right panel). B. The LP burst phase plotted vs. the IPSP amplitudes due to the AB/PD unit for DC 46% and 17%. C. The IPSP peak phase was calculated using the time to peak with respect to the peak of the presynaptic waveform (see Fig. 8B inset for example) and plotted vs. the LP burst phase during the ongoing rhythm for DC 46% (left panel) and 17% (right panel). D. Scatter plot of IPSPAB/PD peak phase in DC 46% vs. 17% showed no correlation to the LP burst phase. Solid diagonal lines in A and B are best linear fits.
