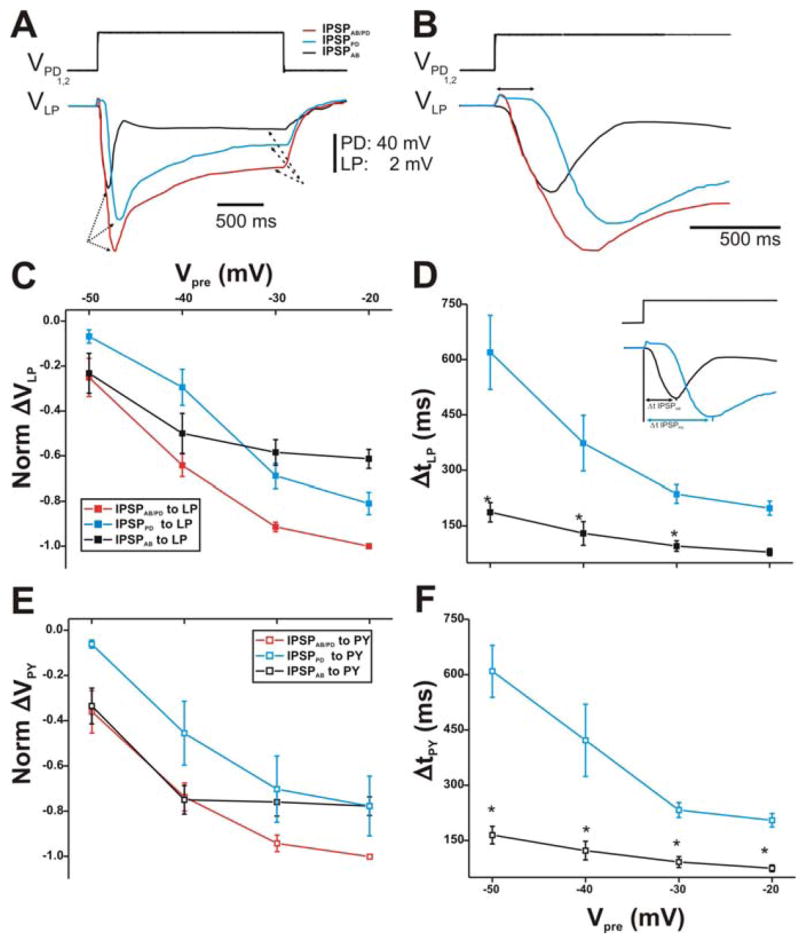
Figure 2. Postsynaptic potentials of the LP and PY neurons in response to stimulations of the PD neurons with a single square pulse.

A. The membrane potentials of the PD neurons were stepped from −60 mV to −20 mV (top trace). The red trace represents combined IPSPs from both the AB and PD neurons (IPSPAB/PD; red trace) in control (TTX saline). In PTX, the AB synaptic output is blocked and the response in the LP neuron is due to the synapse from the PD neurons only (IPSPPD; blue trace). The IPSPPD trace was subtracted from IPSPAB/PD to yield the synapse due to the AB neuron only (IPSPAB; black trace). All IPSPs exhibited a transient peak (dotted arrows) that decayed to a sustained value (dashed arrows). The LP neuron had an initial membrane potential of−59 mV. B. A close-up of the IPSPs in A shows that the time courses of the synaptic response in all conditions were different from each other. The double headed arrow represents the delay in onset of the synaptic response of the PD neurons. C. Synaptic I/O curve for square pulses of 10–40 mV amplitudes used to depolarize the presynaptic PD neurons (N = 6). The values were normalized to the amplitude IPSPAB/PD in response to a step to −20 mV. The amplitude of each IPSP is measured from Vrest to the maximal value of the IPSP. The results show that for Vpre of −50 and −40 mV (from −60 mV), the compound synapse to the LP neuron was mostly from the AB neuron. IPSPPD required more positive PD potentials to activate compared to both IPSPAB/PD and IPSPAB onto LP. D. The time to peak of the IPSPs was measured from the beginning of the presynaptic depolarization to the maximal peak of the IPSP (inset). IPSPPD onto the LP neuron reached its maximum peak value slower than IPSPAB. Moreover, both IPSPs showed a dependence on the presynaptic potential (N = 6). E. Same as in panel C, but using the PY neuron as the postsynaptic target. The response is similar to that seen in the LP neuron. F. Same as in panel D, but using the PY neuron as the postsynaptic target. Again, the results were similar to those of the LP neuron. (* indicates significant difference).
