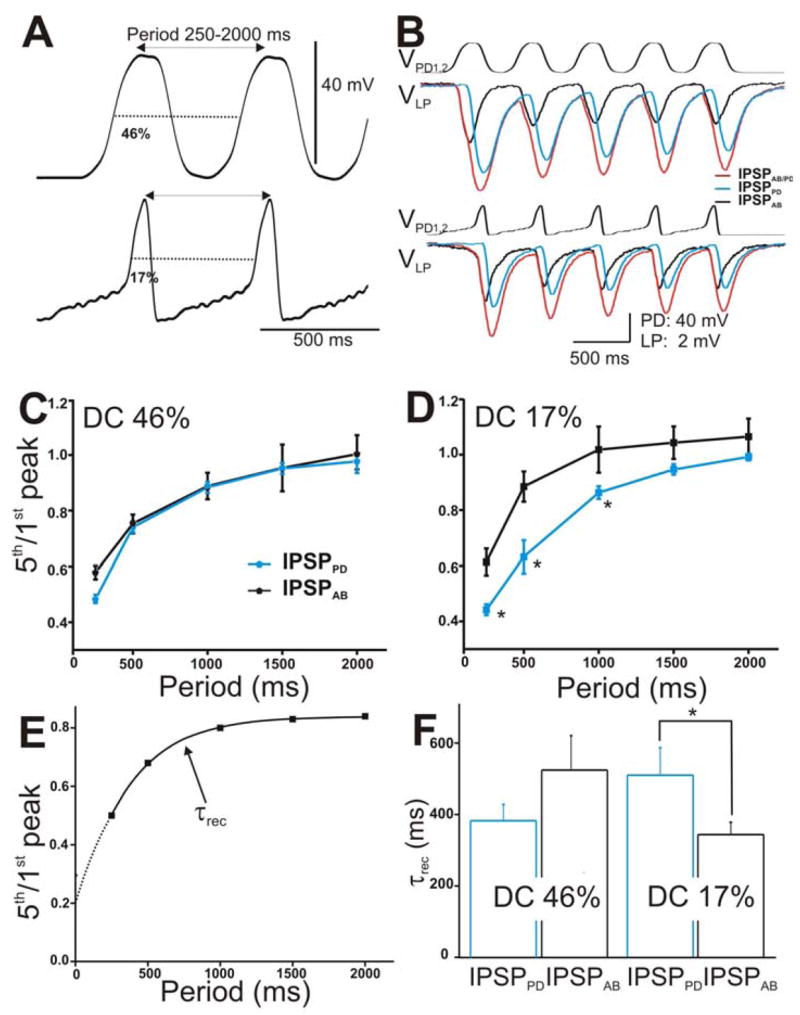
Figure 4. The IPSPs in the LP neuron in response to a train of two realistic PD waveforms.

A. The PD neurons were stimulated with two types of realistic waveforms, DC 46% (top trace) and DC 17% (bottom panel). Both waveforms were pre-recorded in the PD neuron from two different preps, low-pass filtered (at 10 Hz) and amplified to 40 mV amplitudes. They were injected from Vh = −60 mV in a train of 5 pulses with frequencies ranging from 0.5–4 Hz. B. The LP response to DC 46% (top panel) and DC 17% (bottom panel) with cycle period 500 ms. The IPSPs elicited by the individual AB (black trace) and PD neurons (blue trace) and by the compound AB/PD unit (red trace) are superimposed for comparison. C. Extent of depression of the IPSPs (5th/1st peak) in response to DC 46% was plotted vs. cycle periods (N = 6). D. Extent of depression of the IPSPs in response to DC 17% plotted vs. cycle periods showed that IPSPAB exhibited significantly less depression (marked by *) than IPSPPD for cycle periods 250–1000 ms (N = 6). E. The time constant of recovery from depression of the IPSPs was calculated by fitting the 5th/1st ratio vs. cycle periods for each experiment with a single exponential fit (dashed line). F. Average τrec values showed that for DC 17%. IPSPAB recovered significantly faster than IPSPPD (N = 6). (* indicates significant difference).
