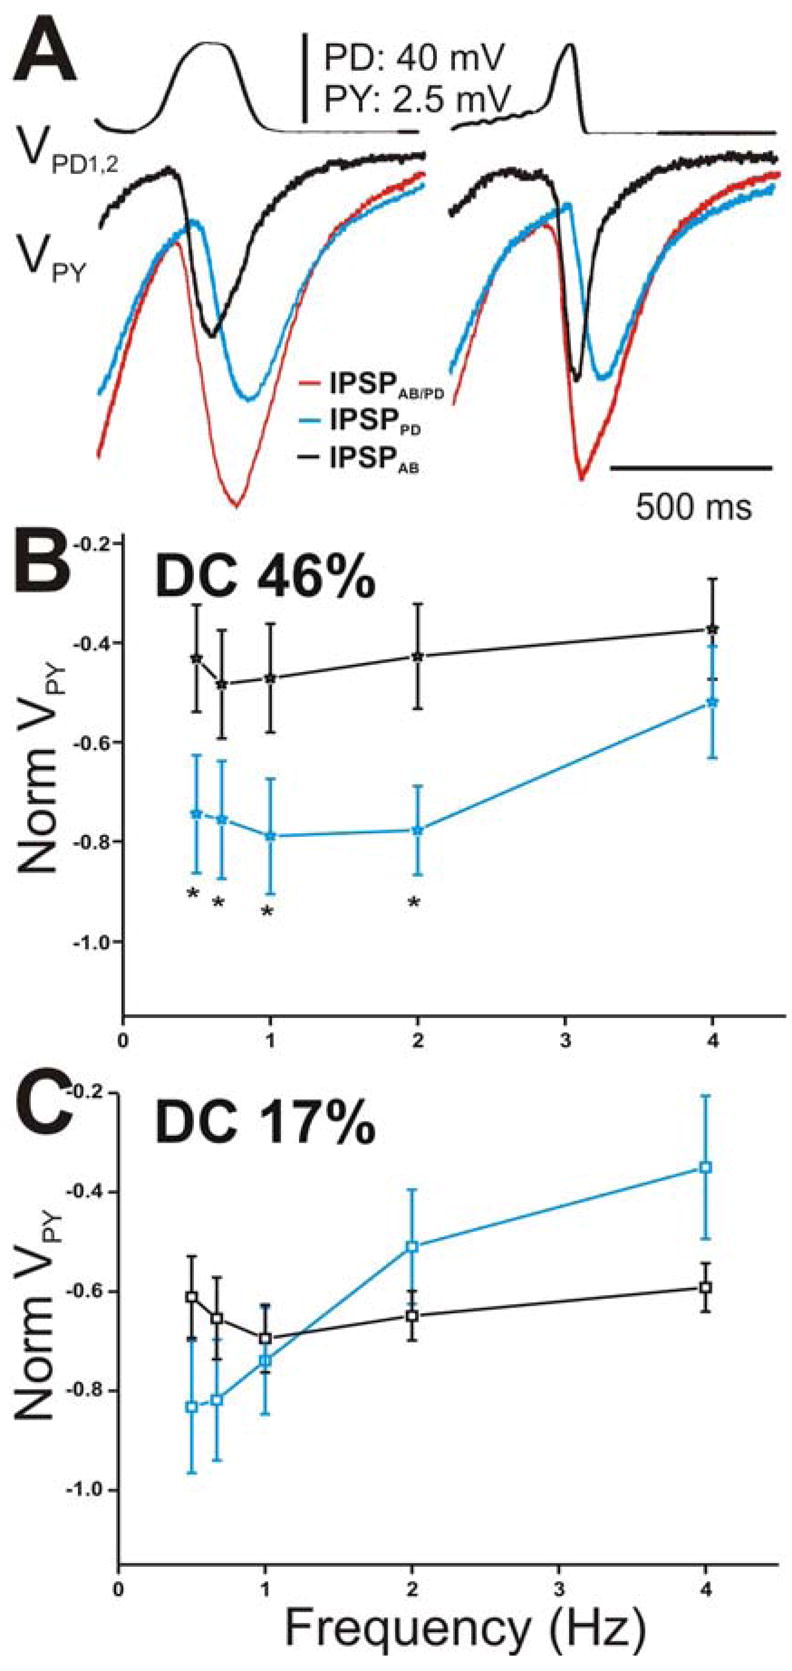
Figure 7.

The peak amplitude of the IPSPs in the PY neuron appeared sensitive to the slope of the rising phase of the presynaptic depolarizations. A. The IPSPs in response to the 5th waveform elicited with DC 46% (left panel) and 17% (right panel) corresponding to cycle period 500 ms. IPSPAB is smaller in amplitude than IPSPPD for DC 46% and equal in amplitude for DC 17%. B. The steady-state amplitudes of IPSPPD and IPSPAB in the PY neurons were normalized and plotted as a function of presynaptic frequency as in Figure 6. The relative contributions of both the AB and PD components were not significantly different from each other at all frequencies tested (N = 6). C. The amplitudes of the IPSPs in response to DC 17% were normalized as in Figure 6 and plotted vs. frequency. Again, no significant difference between the amplitudes at all frequencies tested (N = 6). (* indicates significant difference).
