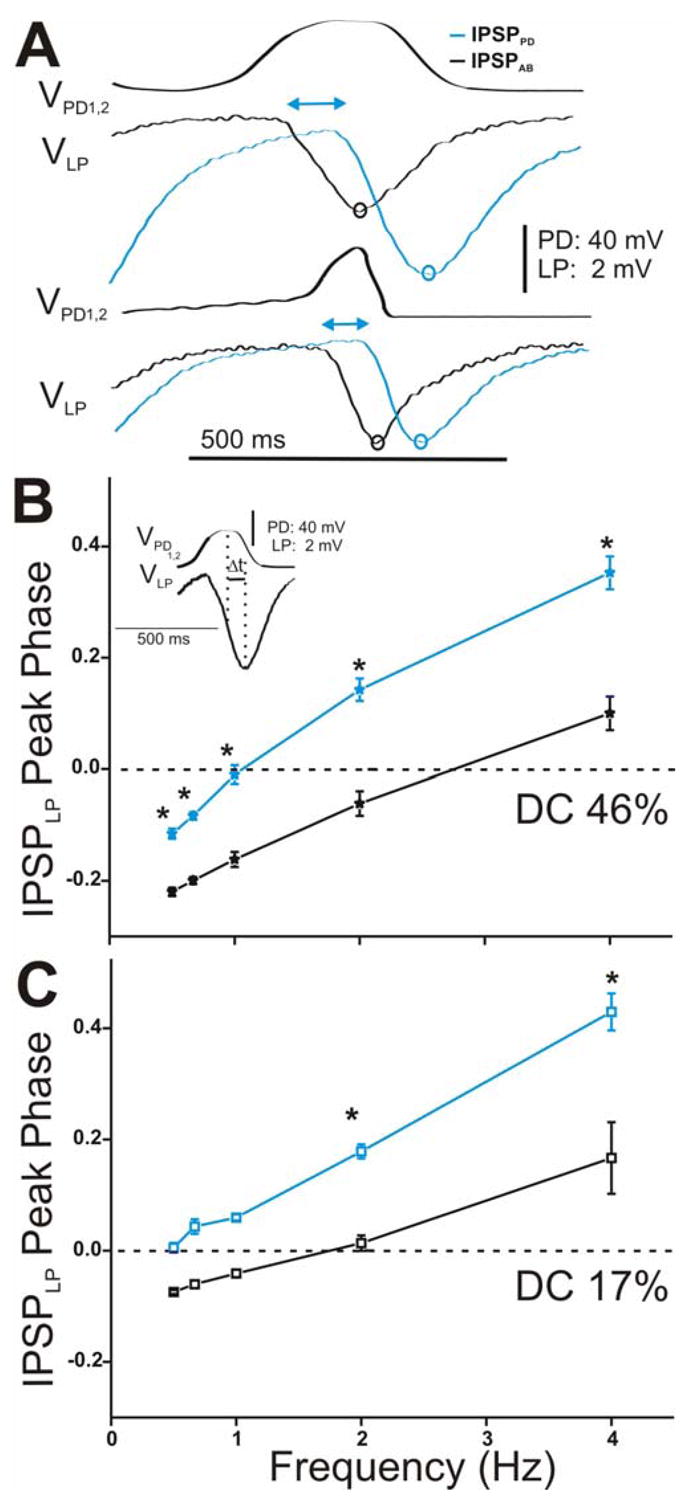
Figure 8.

Time course of synaptic transmission of the IPSPs in the LP neuron in response to the realistic waveform stimulations in the PD neurons and its effect on the LP IPSP peak phase. A. The IPSPs in response to the 5th waveform elicited with DC 46% (top panel) and 17% (bottom panel) at cycle frequency 2 Hz showed that IPSPPD (blue open circles) reached its maximum peak significantly later in time than IPSPAB (black open circles) independent of the duty cycle of the waveform used. The double headed arrows are only meant to represent the delay between the start of hyperpolatization in the LP neuron due to the AB vs. the PD synapse. B. LP IPSP peak phase was calculated as t (measured form the peak of the presynaptic waveform to the peak IPSP) divided by Periodapplied (inset) and plotted vs. frequency (N = 6). In response to DC 46%, the LP IPSP peak phase was significantly delayed due to the synapse from the PD neurons (blue trace). C. Similar results were obtained for DC 17% (N = 6). (* indicates significant difference).
