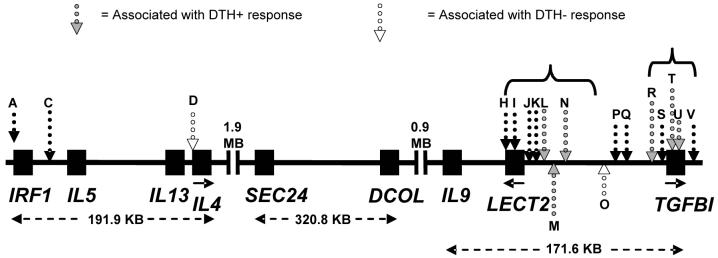
Figure 1.
Drawing of the chromosome 5q23.3-q31.1 region showing relative positions of genes and SNPs (not to scale). Boxes indicate the locations of genes including both exons and introns. Letters referring to SNPs (dotted vertical arrows; open dots are SNPs associated with the DTH− phenotype; grey-filled dots are SNPs associated with the DTH+ phenotype) are defined in Table 2. Distances between the start of the 5' UTR of IRF1 and end of the 3'UTR of IL4, the 5'UTR of SEC24 and 3'UTR of DCOL, and the 5'UTR of IL9 and 3'UTR of TGFBI are indicated with dotted horizontal arrows. Solid horizontal arrows indicate the direction of the coding region for selected genes. Brackets refer to markers in LD clusters (H to O; R to V) as defined by D' (see figure 2). Markers not shown on the figure were not analyzed statistically, either because there was only one allele or they were out of Hardy Weinberg Equilibrium. (See methods section for details.)

