
Figure 2.
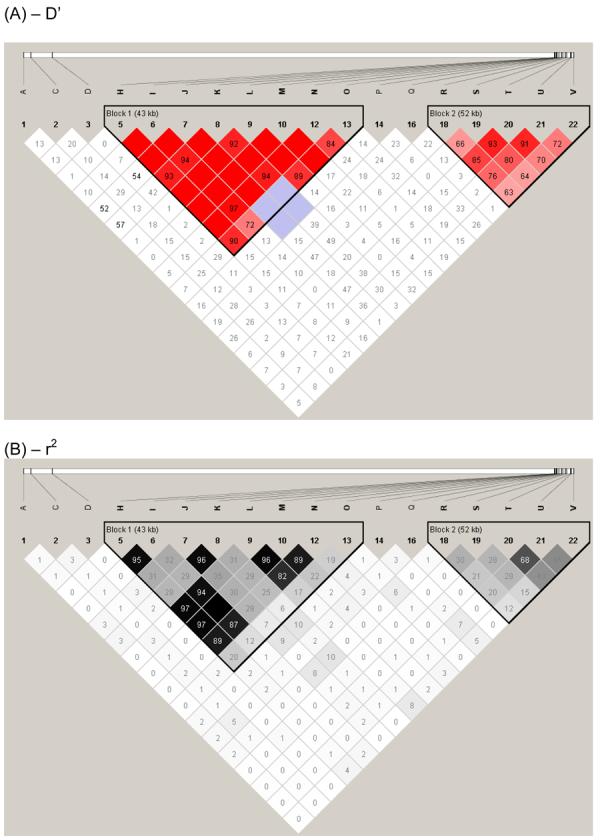
LD plot generated using the default settings in Haploview available from the HapMap Project site (http://www.hapmap.org/). LD between pairs of markers across chromosome 17q11.1-q22 was determined within Haploview using (A) D' or (B) r2 statistics. LD values between markers are indicated at the intercept of the two markers on the matrix. Empty boxes indicate that the LD value is 1. Intensity of colour on the red/pink or black/grey scale indicates the degree of confidence in the LD value. Two main haplotype blocks outlined within the black triangles lie within this region of 5q23.3-q31.1: rs31530 (H) -rs30740 (O) encompassing LECT2; and rs4976360 (R) - rs7725447 (V) encompassing TGFBI. All SNPs used had minor allele frequencies >0.1 (see table 2).