
Figure 3.
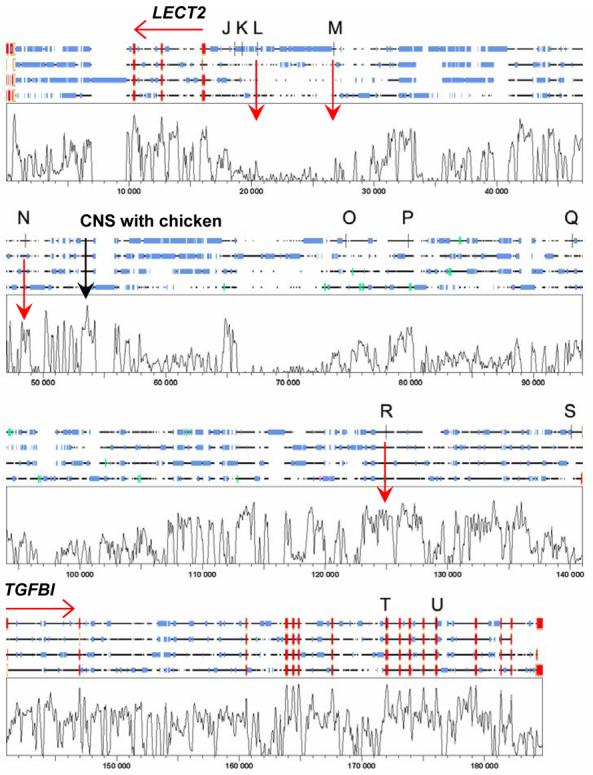
Shows the SYNPLOT output for the multiple alignment of (top to bottom) human, dog, cow and mouse sequences carried out across the region LECT2 to TGFBI on chromosome 5q31.1 using LAGAN. On the 4-species alignments red boxes define exons at the two genes, blue boxes indicate repetitive sequence, green boxes show GENSCAN auto-annotated putative exons, vertical black bars show the positions of SNPs (J to U, see table 2) used in this study. The plot shows degree of conservation of sequence across all 4 species, on a vertical scale 0-100%. CNS are defined as regions of conserved sequence that are approaching or similar in magnitude to that observed at the known exons for the two genes. Examples of potential regions of CNS of interest are indicated by vertical red arrows, including the single CNS showing high conservation between these mammalian species and chicken (data not shown).