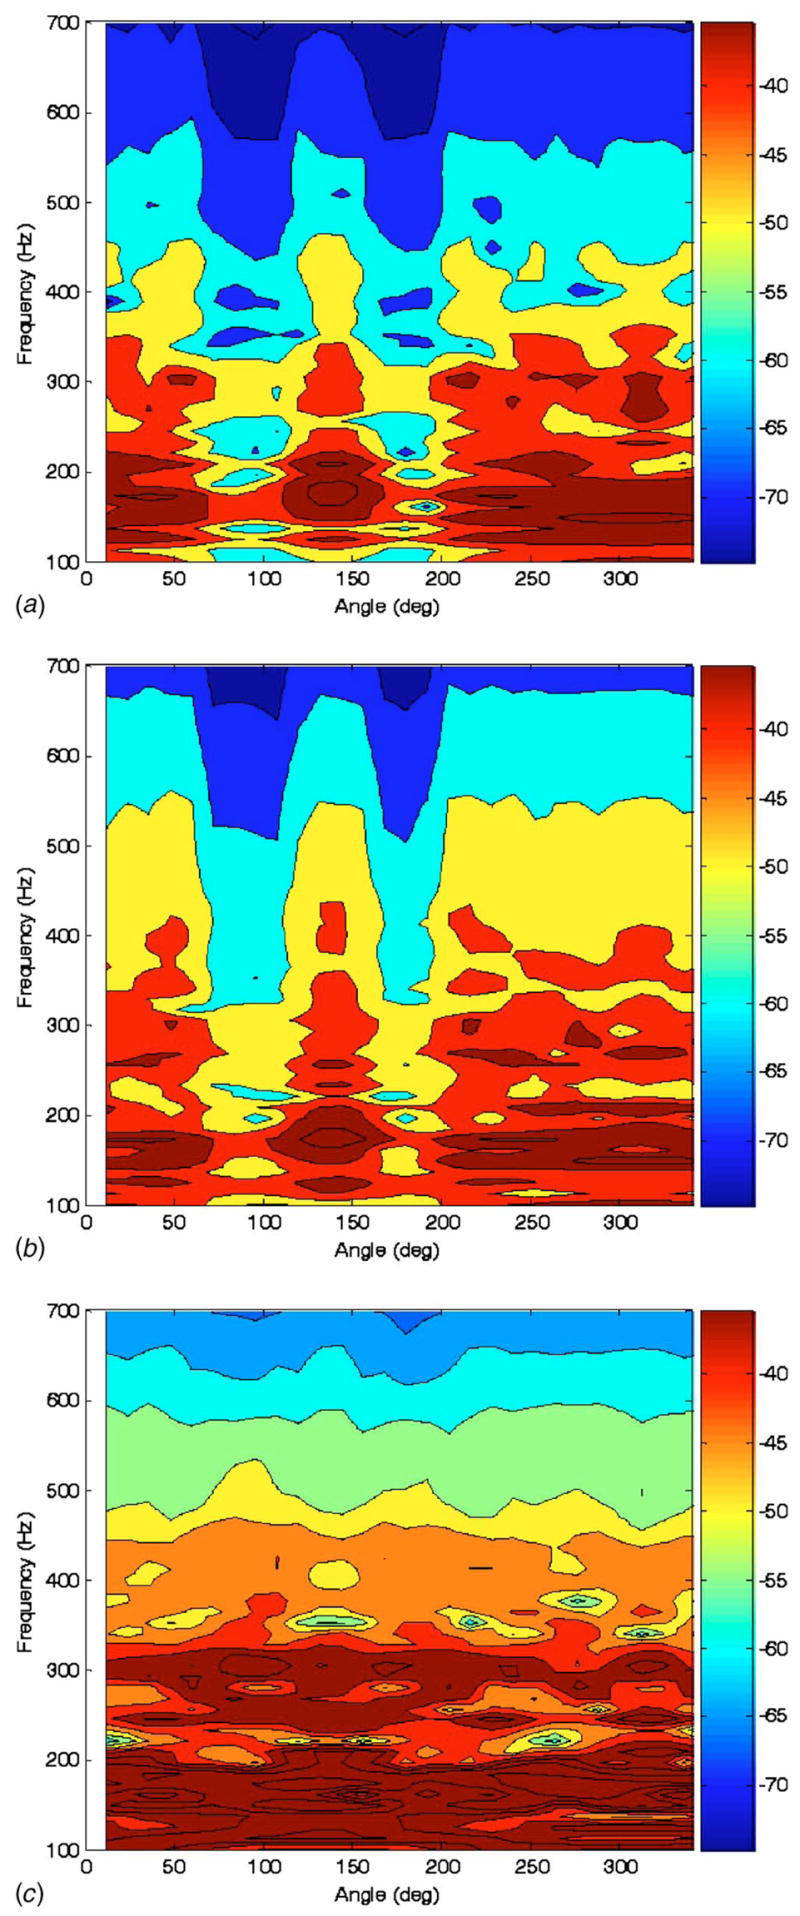
Fig. 8.

Calculated frequency response of conical surface normal velocity (color scale dB ref: 1 mm/s Pa) to “trachea” acoustic pressure excitation at three vertical heights indicated in Fig. 5 of (a) 160 mm, (b) 120 mm, and (c) 80 mm measured from the bottom of the phantom model
