FIGURE 3.
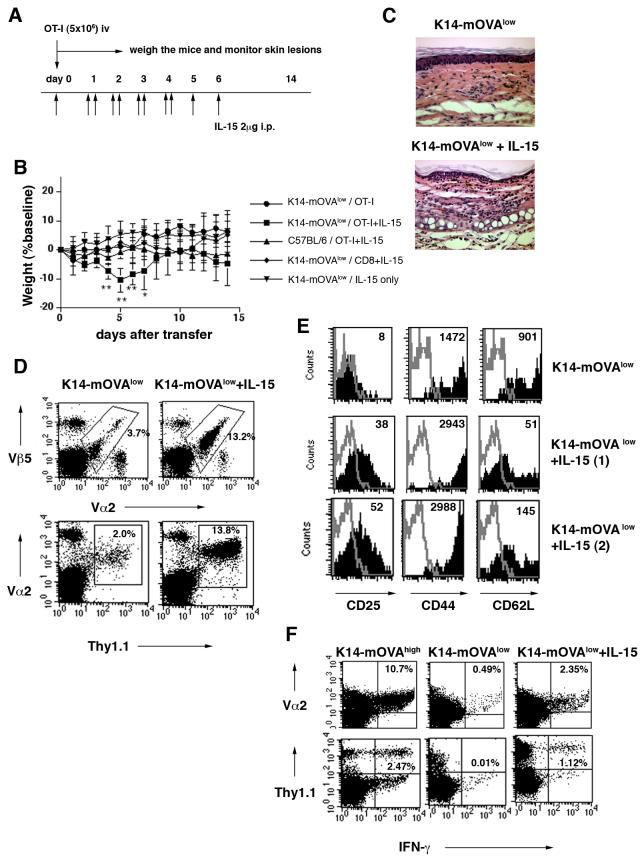
IL-15 administration induces full activation of autoreactive T cells, and leads to the onset of GvHD-like skin disease in K14-mOVAlow Tg mice
(A) The protocol used for IL-15 treatments and cell transfer is illustrated.
(B) OT-I cells or CD8 T cells from C57BL/6 mice were injected into various mice with or without IL-15 treatment (n= 3-6 per group). Error bars represent SD. **P<0.001 and *P<0.05 versus the other groups. Graph is representative of three independent experiments.
(C) On day 7 after injection, tissue sections of ears were stained with hematoxylin-eosin (H&E). Magnification: ×20 One representative result of five is shown.
(D-F) Naïve OT-I cells were adoptively transferred into K14-mOVAlow Tg mice with or without IL-15 treatment. Results shown represent one of five experiments with 3-5 mice in each.
(D) Five days after transfer, peripheral LNs were harvested and cells were stained with anti-Vα2-FITC and anti-Vβ5-APC and subjected to FACS analysis. The percentages of Vα2Vβ5 cells within the lymphocyte gate are indicated (upper panel). Thy1.1+OT-I cells were used instead of OT-I cells and the percentages of Thy1.1Vα2 cells within the lymphocyte gate are indicated (lower panel). It was confirmed that Thy1.1Vα2 cells were all Vβ5 positive.
(E) On day 5 after injection of OT-I cells, LNs were analyzed for expression of various activation markers. Cells were gated on Vα2Vβ5 cells. The thin line represents isotype control staining. Numbers in histograms indicate MFI.
(F) Intracellular IFN-γ staining was performed on splenocytes on day 5 after injection of OT-I cells (upper panel) or Thy1.1+OT-I cells (lower panel). The percentage of IFN-γ producing Vα2+cells and Thy1.1+cells is indicated.

