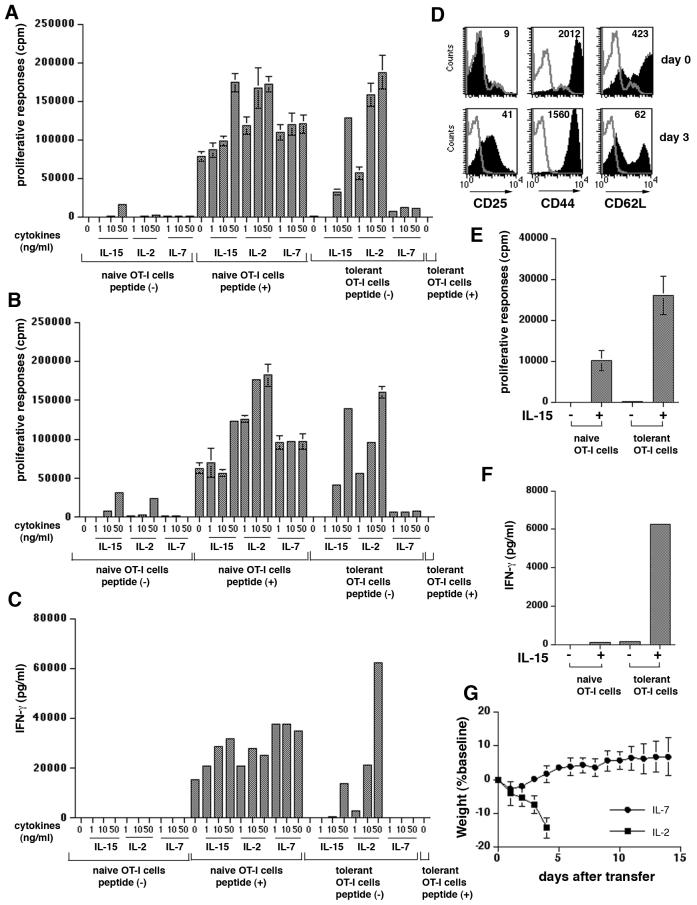
FIGURE 4.
IL-15 is able to qualitatively alter the nature of OT-I cells.
Five million OT-I cells or Thy1.1+OT-I cells (B) were injected into K14-mOVAlow Tg mice. Five days later, LNs and spleens from K14-mOVAlow Tg mice were harvested, and OT-I cells were purified by negative and positive selection.
(A) Naïve or tolerant (OT-I cells purified from K14-mOVAlow Tg mice adoptively-transferred with OT-I cells) OT-I cells were cultured with various concentrations of cytokines in the presence of peptide-pulsed or non-pulsed APCs. Naïve OT-I cells cultured with peptide-pulsed APC and with non-pulsed APC were used as positive and negative controls, respectively. 1μCi of [3H] thymidine was added during the last 16 hr of a 3 day culture. Assays were performed in triplicate and the error bars represent SD.
(B) The same as (A) except that naïve and tolerant Thy1.1+OT-I cells were used.
(C) Naïve or tolerant OT-I cells were cultured with various concentrations of cytokines in the presence of peptide-pulsed or non-pulsed APCs. Two days later, supernatants were removed and production of IFN-γ was determined by ELISA.
(D) Tolerant OT-I cells were stimulated with 50 ng/ml of IL-15 in a 24-well plate. Three days later (day 8 after iv), expanded OT-I cells were harvested and analyzed by flow cytometry. The histograms illustrate expression of various markers on Vα2Vβ5 cells (shaded histograms). The thin line represents isotype control staining and numbers in histograms indicate MFI.
(E) Naïve or tolerant OT-I cells were stimulated with 50 ng/ml of IL-15 in a 96-well plate. [3H] thymidine was added during the last 16 hr of a 3 day culture. Assays were performed in triplicate and the error bars represent SD.
(F) Naïve or tolerant OT-I cells were cultured without antigen in the presence or absence of IL-15 (50 ng/ml) for 48 hr, and the amount of IFN-γ production in the supernatant was measured by ELISA.
(G) Five million OT-I cells were injected into K14-mOVAlow Tg mice with IL-2 or IL-7. The same dose of IL-2 and IL-7 as IL-15 was used (n= 3-5 per group). The mice were weighed and skin lesions were monitored for 14 days. Error bars represent SD
All results are representative of al least three independent experiments.

