
Figure 3.
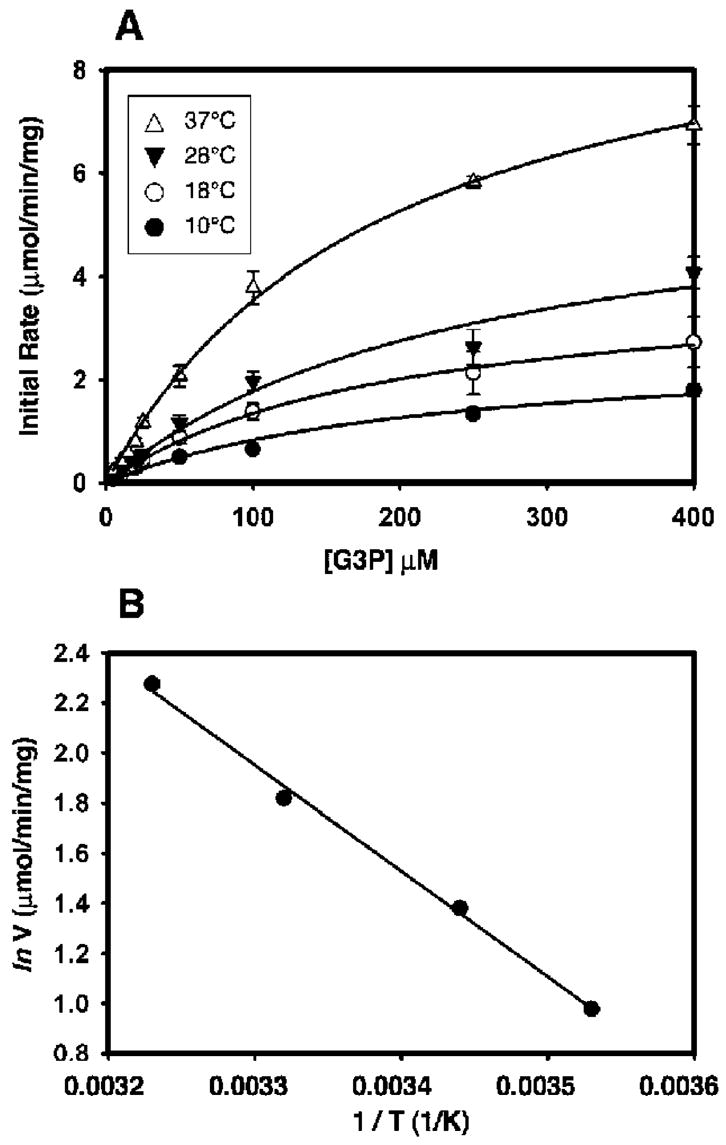
Kinetic measurements of the G3P transport by GlpT in reconstituted proteoliposomes. (A) Effect of temperature on the kinetic properties of the G3P transport mediated by GlpT reconstituted into proteoliposomes. The data represent the mean ± SE of three separate measurements. Curves were fitted with the Michaelis–Menten equation and used to calculate the Km and Vmax values at each temperature studied. The data clearly show the temperature dependence of the transport rate. (B) Arrhenius plot of the rate of the G3P transport into proteoliposomes between 10 and 37 °C. The plot was generated using the natural log of the Vmax values presented in Table 2.