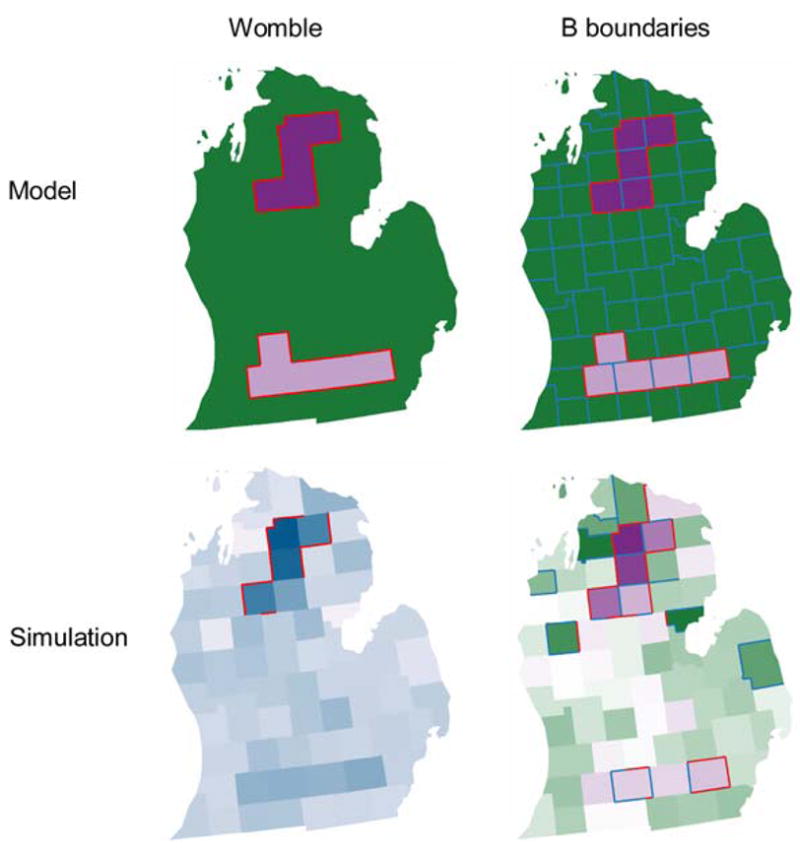
Fig. 4.

Womble (left column) and boundary analysis using little b (right column) for the modeled risk surface (top row) and realization of that surface as a Poisson process (bottom row). Red lines indicate statistically significant boundaries, blue lines indicate significant links between areas of similar values. Both methods found all boundaries for the model, although the Womble approach could not identify significant links. When noise is introduced in simulation the Womble approach missed more true boundaries, but the b-approach misidentified two edges as boundaries
