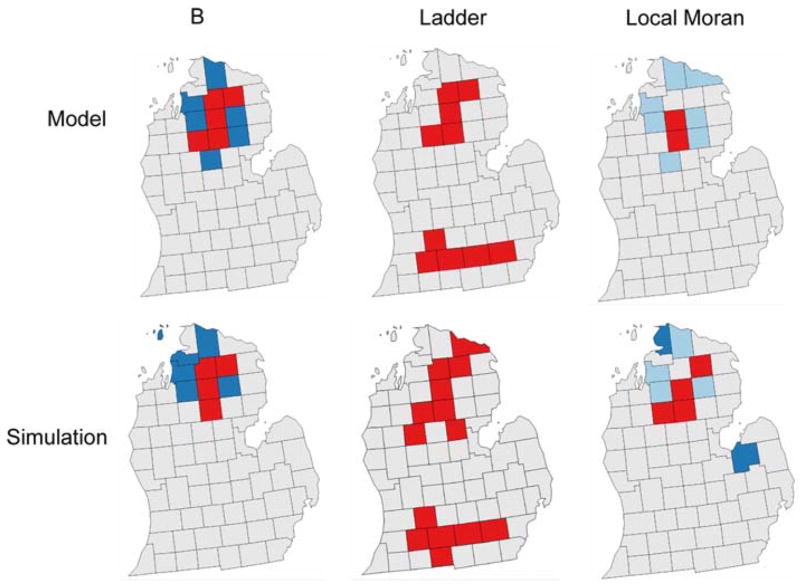
Fig. 5.
Results of the analysis of the modeled (top row) and simulated data (bottom row) for the big b (first column), ladder (second column) and local Moran (third column) approaches. Only the Ladder approach correctly detected both the north and south clusters in both the model and simulation surfaces, but at the expense of several false positives

