
Figure 1. Elevated global transcription in ES cells.
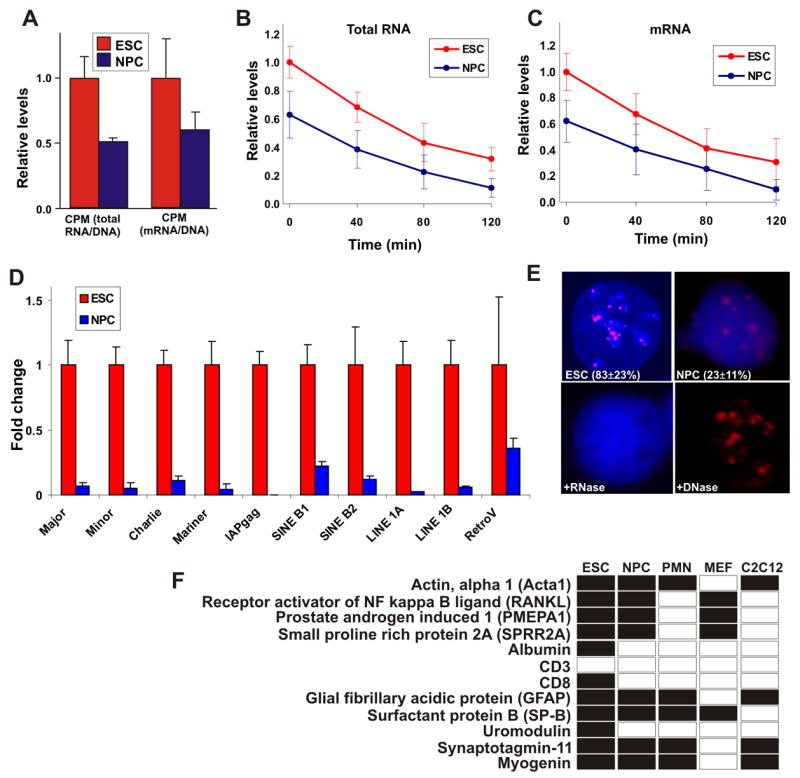
(A) Total RNA transcriptional activity (left) and mRNA transcriptional activity (right) in ES cells (red) and NPC (blue). Cells were incubated with 3H-labeled uridine for 4 hrs. Values represent averages ± SD from 3 experiments.
(B–C) As in (a) but following 2 hrs of incubation, 3H-uridine was removed and fresh medium supplemented with 0.125 μM actinomycin-D was added for additional 2 hrs. Samples were collected every 40 min and transcriptional activity of both total RNA (b) and mRNA (c) levels was determined.
(D) Real-time quantitative PCR of the indicated repeat sequences and transposable and retroviral elements in ES cells (red) and NPC (blue) normalized against Cyclophilin B. Values represent averages ± SD from 3 independent experiments.
(E) RNA-FISH for the major satellite repeat using Cy3-labled locked nucleic acid (LNA) probes in embryonic stem cell (ESC) and ES cells-derived neuronal progenitor cells (NPC). When ES cells were pretreated with RNase A signal was abolished (+ RNase), while DNase I treatment retained the signal (DNase). Values represent averages ± SD from 3 experiments. At least 50 cells were scored per experiment.
(F) Lineage-specific transcription in undifferentiated ES cells. Shown is a detection table (black, detected; white, undetected) of a selection of lineage-specific genes detected by RT-PCR in undifferentiated ES cells, NPC, ES cells-derived post-mitotic neurons (PMN), MEFs or differentiated C2C12 cells. Genes were considered not expressed when undetected in 2 independent experiments. Several genes required re-amplification for detection (Figure S3). All samples were treated similarly. For copy number determination see Supplementary Methods.