
Figure 3. Elevated intergenic and intronic transcription patterns in ES cells.
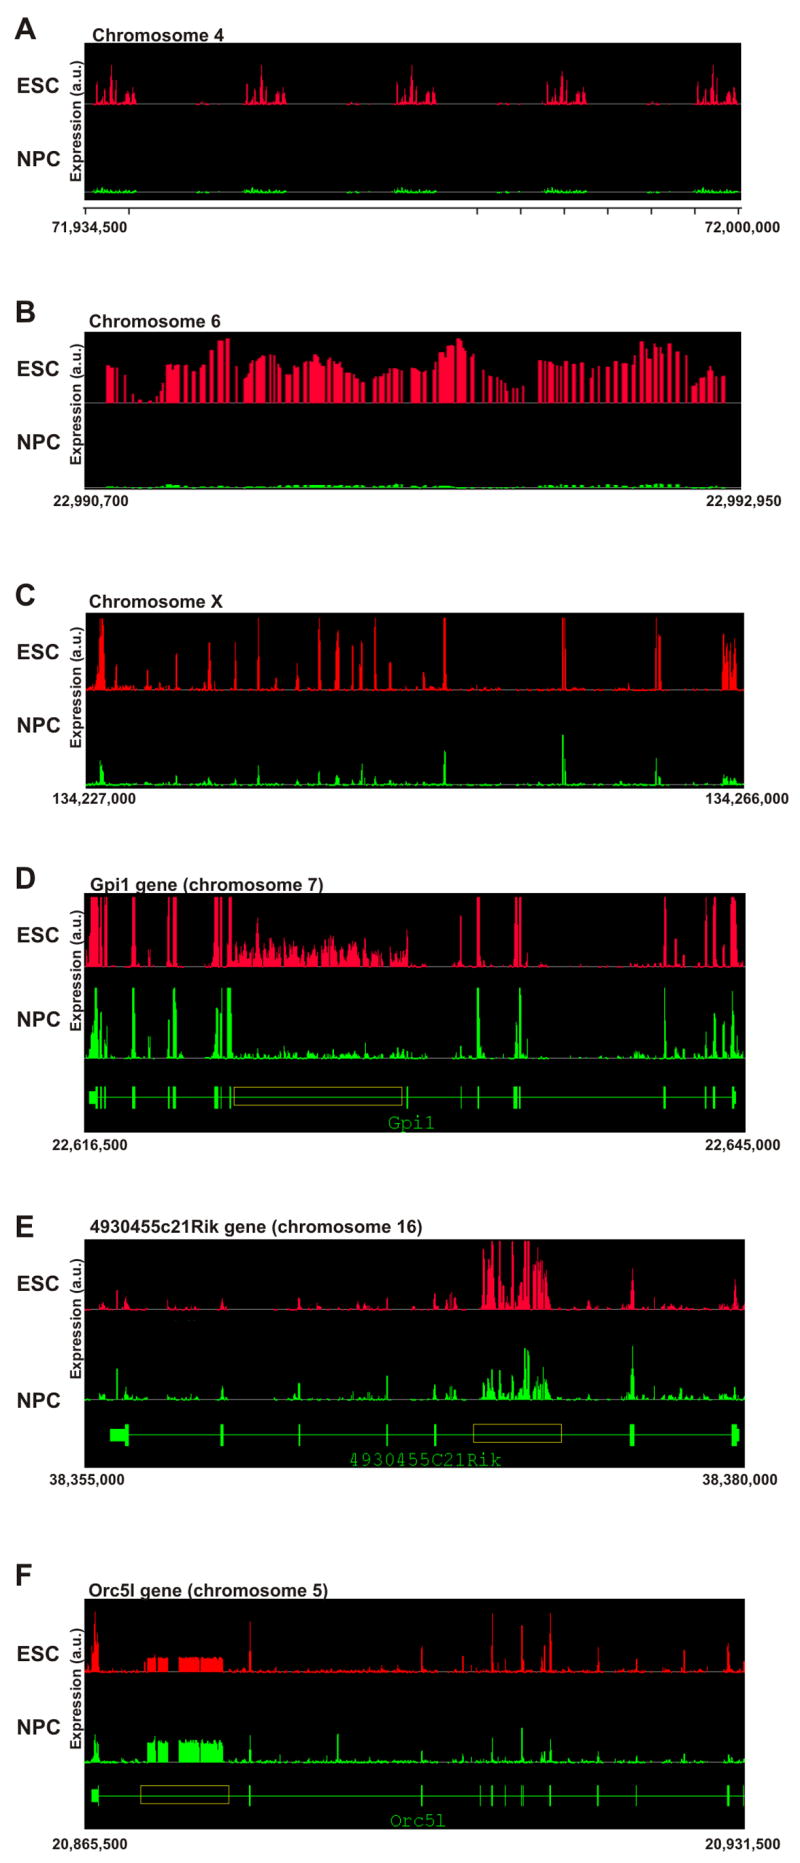
Composite graphs depicting signal intensity form the independent biological replicas represent probe intensity per genomic coordinates. All represented coordinates are in the mm.NCBIv33 version of the mouse genome and are indicated below each panel. Y-axis denoted arbitrary units of expression.
(A–C) Intergenic transcription.
(A) A ~65 kb intergenic region on chromosome 4 displaying repetitive bursts of transcription in ES cells (red, top), but not in neuronal progenitor cells (green, bottom).
(B) A 2,250 bp intergenic region on chromosome 6, which is active in ES cells (red, top) but not in NPC (green, bottom).
(C) A 29 kb intergenic region on chromosome X, where parts are active in both ES cells and NPC and parts are active in ES cells only.
(D–F) Intronic transcription.
(D) The annotated region of the Gpi1 gene (~28 kb) on chromosome 7 (green, bottom) shows intronic transcription (yellow box, > 7.5 kb) in both ES cells (red, top) and NPC (green, middle) but transcription level is considerably higher in ES cells.
(E) The annotated region of the 4930455C21Rik gene (~25 kb) on chromosome 16 (green, bottom) shows a burst of transcription inside the fifth intron in both ES cells (red, top) and NPC (green, middle). Despite higher expression of the 4930455C21Rik gene in NPC, intronic transcription is higher in ES cells. Note that unlike Gpi1, exons in this case are active at lower levels than the intronic transcription.
(F) The annotated region of the Orc5l gene (~66 kb) on chromosome 5 (green, bottom). A long intronic region (yellow box, > 8 kb) inside the Orc5l gene is active. The Orc5l gene itself is also active and the intronic transcription is lower than the exonic transcription. In this example, intronic transcription is higher in NPC (green, middle) than in undifferentiated ES cells (red, top).