
Figure 5.
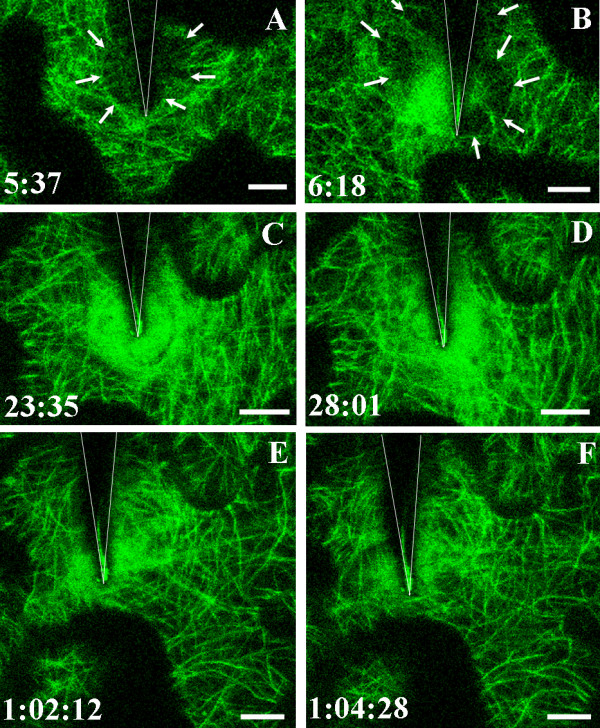
Alterations in microtubule arrays underlying the point of contact. Images in A and B are from two different experiments to that shown in Figure 4 and illustrate the localized microtubule depolymerization and formation of the microtubule-depleted zone (arrows) beneath the point of contact with the needle (outlined by the V-shaped lines). C-F are selected images taken at later time points in the same experiment shown in Figure 4. In C and D, taken 23–28 minutes after contact, the diffuse cloud of fluorescence fills the region previously occupied by the microtubule-depleted zone. In E and F, taken 1 hour after contact, the cloud of diffuse fluorescence has diminished and a subset of microtubules forms a circumferential array around the needle tip. Bar = 10 μm.