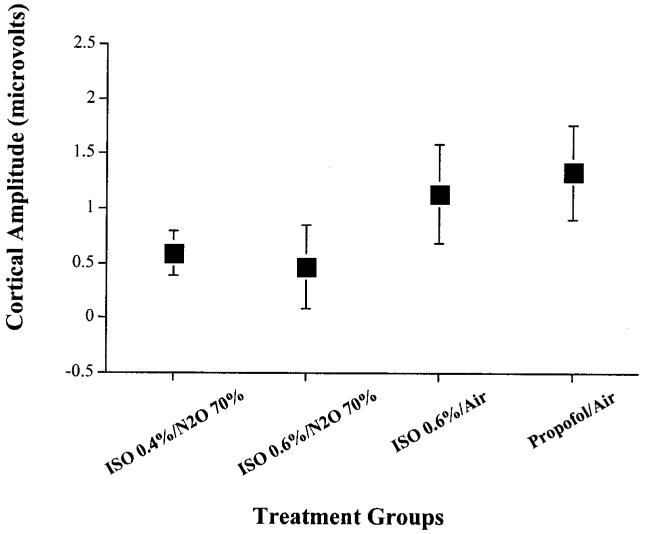
Figure 2.
Mean cortical SSEP amplitude measurements for each anesthetic combination. Treatment #4 (propofol 120 μg · kg-1 · min-1 + air + O2 30%) allowed for significantly more robust cortical SSEP amplitude measurement than treatments 1, 2, and 3. The x-axis represents the four different anesthetic maintenance combinations studied: treatment #1, isoflurane 0.4% + N2O 70% + O2 30%; treatment #2, isoflurane 0.6% + N2O 70% + O2 30%; treatment #3, isoflurane 0.6% + air + O2 30%; treatment #4, propofol 120 μg · kg-1 · min-1 + air + O2 30%. The y-axis represents cortical SSEP amplitude size measured in microvolts. Each box plot represents the mean cortical SSEP amplitude value observed for each anesthetic maintenance combination. The lines that extend from the top and bottom of the box-plot represent the standard deviation in cortical SSEP amplitude values observed for each anesthetic maintenance combination.

