
Figure 5.
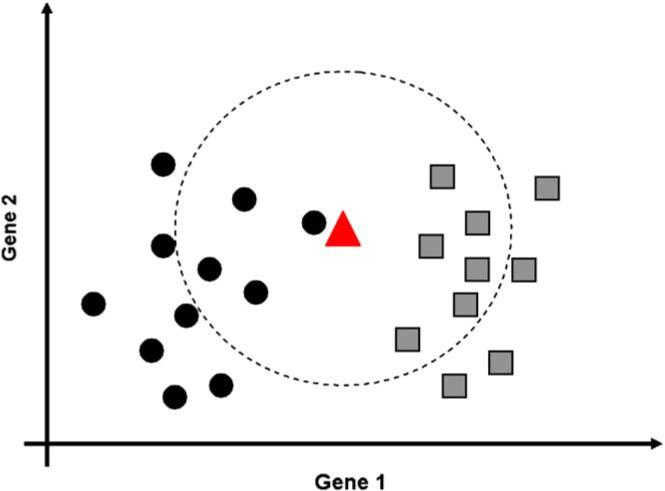
k-Nearest Neighbor (k-NN) classification rule. This method is used in class prediction studies. The figure illustrates the 10-Nearest Neighbor (10-NN) rule in a two-class prediction problem using the expression levels of two genes (gene 1 on the horizontal axis, gene 2 on the vertical axis). The members of the two classes are designated by circles and squares, and their membership is known in advance. The triangle represents the expression values for these two genes for a new sample that needs to be classified. The large dotted circle contains the 10 nearest neighbors of the new sample. A neighbor corresponds to a sample that has similar expression values. Among the closest 10 neighbors of the red triangle, 6 are squares and 4 are circles. Therefore, the 10-NN rule predicts that the new sample belongs in the square class. Note that if we used only one neighbor (1-Nearest Neighbor rule), the same sample would be classified as belonging to the other class (circles), because the closest neighbor of the new sample (red triangle) is a circle and not a square.