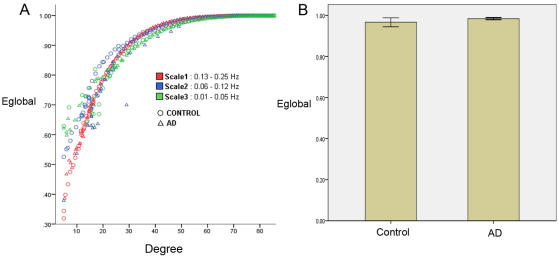
Figure 3. Global efficiency of whole-brain functional connectivity network.
(A) Global efficiency measure (Eglobal), for the AD group (Δ) and the control group (○) at three frequency intervals–0.01 to 005 Hz (green), 0.06 to 0.12 Hz (blue), and 0.13 to 0.25 Hz (red). The mean Eglobal value is low (0.78<λ<1) and shows similar trends at all the scales. (B) For the frequency interval 0.01 to 005 Hz (green)–mean Eglobal values for the AD group and the control group for networks derived by thresholding the correlation matrices such that the network has K′ edges. No significant differences in the mean Eglobal values were observed. Error bars represent values two standard deviations from the mean.

