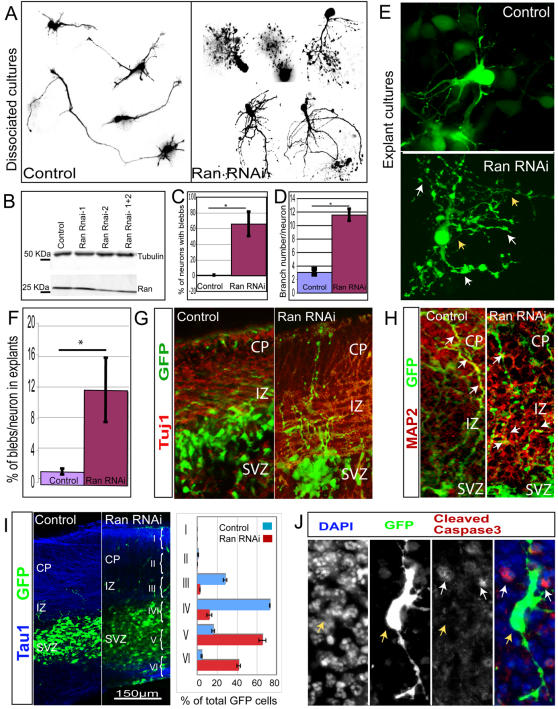
Figure 5. Ran knock down by RNAi results in abnormal neurite morphology in mouse neurons.
(A) Cortices from E14 embryos were transfected by electroporation with either a control GFP plasmid or Ran RNAi contructs, and then dissociated and cultured for 96 hours. Analysis of dissociated neuron morphology shows Ran RNAi neurons have increased number of blebs and branches (right panel) compared to control neurons (left panel). (B) Ran knockdown in nih-3T3 cells transfected with control GFP vector and Ran RNAi constructs. Equal loadings of total protein shown by tubulin signal demonstrates a decrease in the amount of Ran by about 50% in the presence of Ran Rnai-2 and when the two constructs are combined. (C) Analysis of the increase in the number of blebs in dissociated neurons. A significant increase in the number of blebs is observed upon Ran knockdown (p = 0.02). The average number of neurons with blebs is presented as percentage of the total neuron number (Control = 0.68+/−1.2 SDEV, n = 153; Ran = 66.7+/−15.5 SDEV, n = 36). (D) Analysis of the branching phenotype in dissociated neurons show a very significant increase of branching (p<0.0001) upon Ran knockdown (11.56+/−0.88 SEM n = 17) compared to the control neurons (3.07+/−0.41 SEM n = 24). (E) A Z-series reconstruction of a Ran RNAi neuron (lower panel) shows an abnormal increase in branch arborization of the processes (yellow arrows) and bleb number (white arrows) compared to the control (upper panel). (F) Analysis of bleb number in explant cultures. The total number of blebs and cell nuclei were counted per section for three independent experiments. The average ratio of bleb per nuclei (shown as a percentage) is significantly increased (p = 0.0007) in the Ran RNAi explants (12.6+/−4.2 SEM) compared to the control explants (1.7+/−0.4). (G) Ran RNAi neurons labeled with GFP (green) have processes that are immunoreactive for the neuronal marker Tuj1 (in red) (2nd panel) similar to control neurons (1st panel). (H) MAP2 (red), a dendritic marker presents smaller areas of colocalization with GFP (green) in Ran RNAi neurons (right panel) compared to control (left panel) white arrows indicate areas of colocalization. (I) Analysis with TAU1 (blue) shows Control (left panel) and Ran RNAi (right panel) neurons labeled with GFP (green). Quantitation of GFP cell distribution in electroporated explants shows the percentage of total cells counted per Bin, a representative experiment is shown (error bars are standard error of the mean SEM). Control Bins: II = 0.7+/−0.3; III = 22.9+/−1.5; IV = 59.6+/−0.2; V = 13.1+/−1.2; VI = 3.6+/−0.5. Ran RNAi Bins: II = 0.1+/−0.08; III = 2.3+/−0.06; IV = 9.9+/−2.1; V = 53.6+/−2.9; VI = 34.1+/−1.5. (J) Analysis of cell death in explants with anti-Cleaved Caspase3 (red) immunoreactivity shows that Ran RNAi electroporated GFP neurons (yellow arrows) do not colocalize with anti-Cleaved Caspase3 (white arrows).

