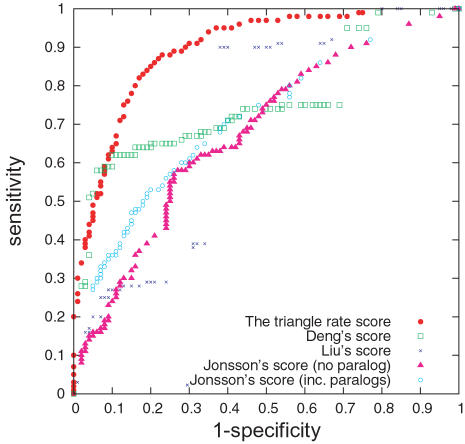
Figure 2. ROC Curves of Predictive Scores.
The ROC curves, 1 minus specificity vs. sensitivity, for predicting yeast protein interactions using domain interaction based approaches (Deng et al.'s score and Liu et al.'s score), a homology-based approach (Jonsson et al.'s score plus paralogs) and our network-based approach (the triangle rate score).

