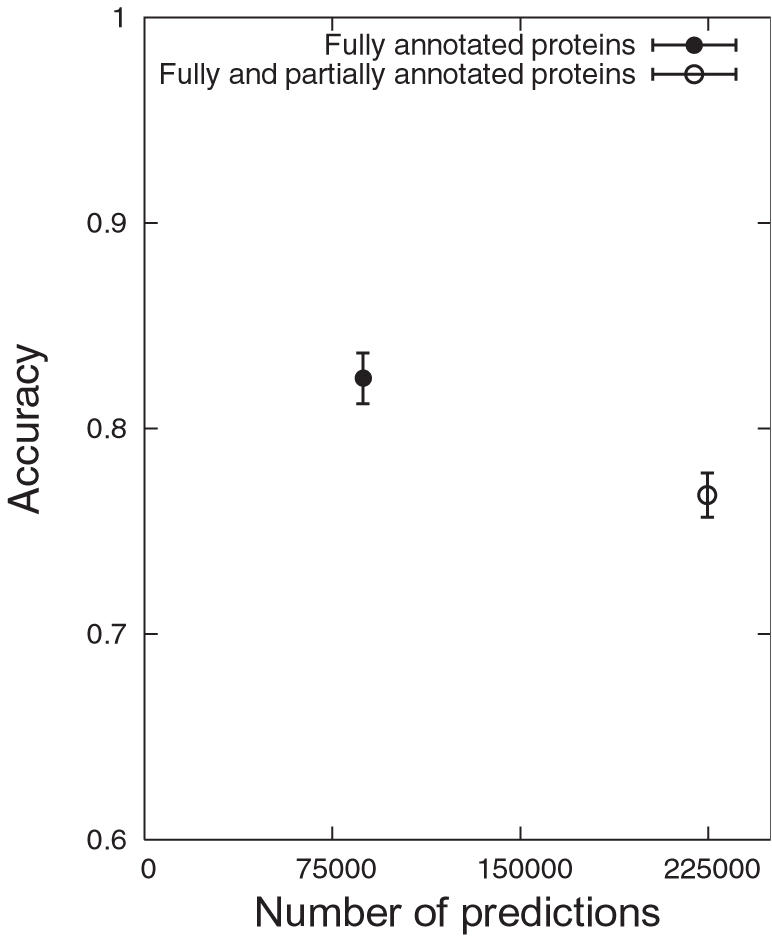
Figure 7. Accuracy and Coverage.

Comparison of the number of predictions and accuracy between using, firstly, fully annotated proteins and secondly, fully and partially annotated proteins; the accuracy is the fraction of correct predictions out of all predictions against the reference set and is presented by an error bar (mean±2*standard deviation).
