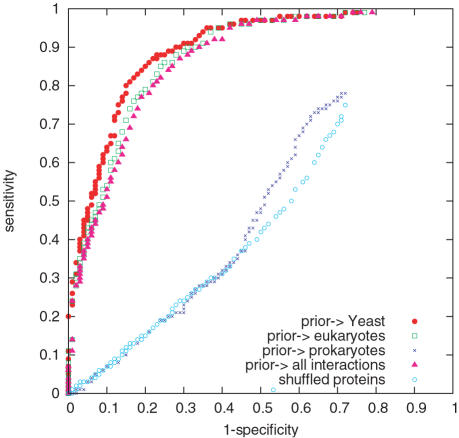
Figure 8. Performance by Using Different Prior Data Bases.
ROC curves for the triangle rate score using upcast sets constructed, firstly, from yeast only, secondly, from all eukaryotes, thirdly, from all prokaryotes, and lastly, from all organisms. Randomly shuffled proteins are added for comparison.

