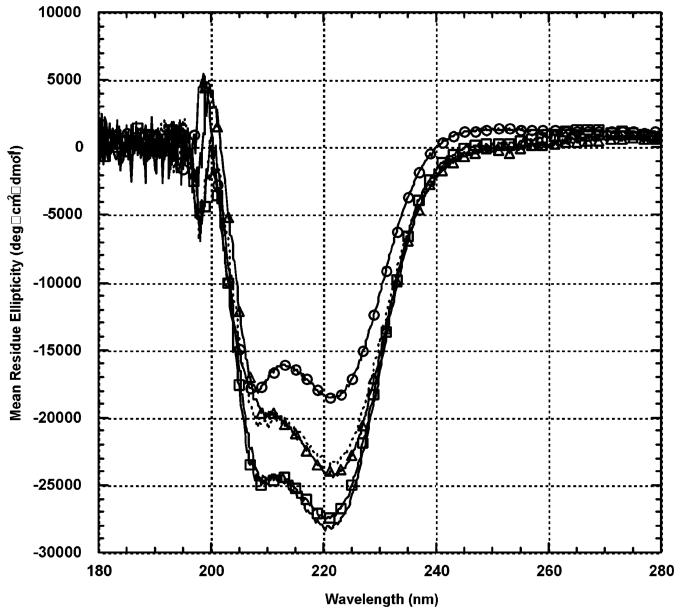
FIGURE 5.
CD on synthetic wt bZIP in the presence of DNA duplexes: synthetic wt bZIP control (○), C/EBP (△), Arnt E-box (□), nonspecific control (···), and AP-1 (-). Protein dimer was placed in 200 μL of 12.5 mM potassium phosphate buffer (pH 7.0), 50 mM KCl, such that final concentrations of protein dimer and DNA duplex were 2.5 μM each. Samples were equilibrated for 5 min at 15 °C prior to measurement. Each spectrum was averaged five times, and curves were not subjected to smoothing. The DNA control spectrum (including buffer) was subtracted from each protein-DNA spectrum.

