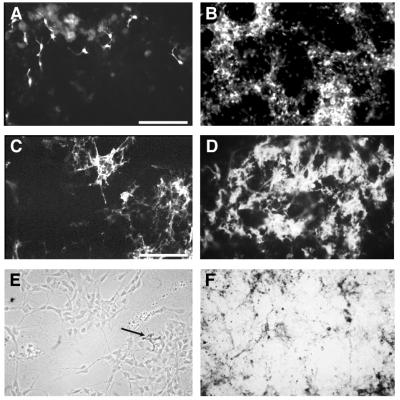
Figure 4.
Differentiation of melanoblasts and glial cells in d9-NCC cultures in the absence (Left) and presence (Right) of ET3. (A and B) The population of melanoblast/cyte early marker-positive melanoblasts increases after ET3 treatment (B) as compared with controls (A). (C–F) SMP-immunoreative glial cells also expand in response to ET3 (compare C and D); pigment cells are visible in E (arrow) and F (same fields as C and D, respectively). A–D, UV light; E, phase-contrast; F, bright-field. (Bars = 260 μm in A and B; 83 μm in C–F.)

