
Figure 3.

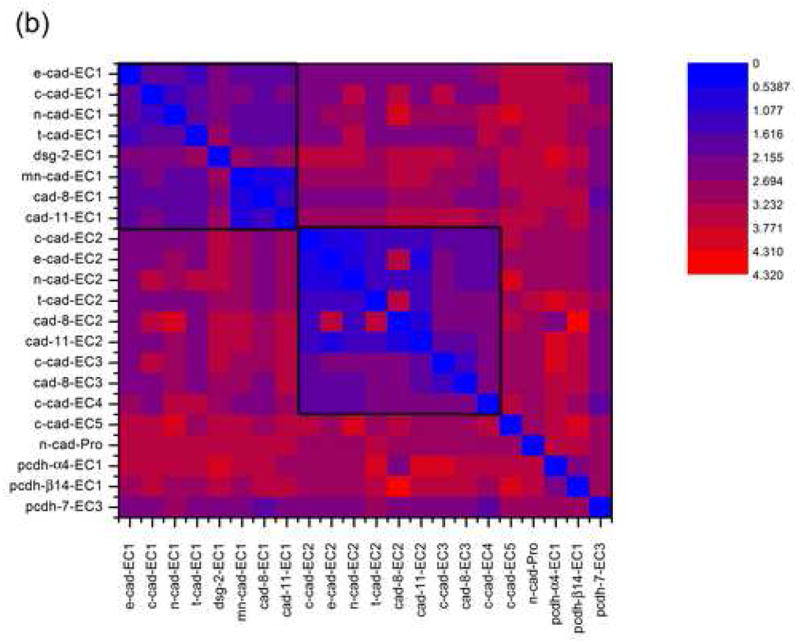
Structural alignment of 22 cadherin domains. (a) Ribbon representation of the aligned domains, in stereo. The β strands of sheet I are shown in purple and of sheet II in green. The structural alignment was constructed using Ska43. (b) Contour plot of all-against-all RMSD values for cadherin domains. The boxed regions indicate EC1s (upper left) and ECs 2, 3, and 4 (center).