Abstract
A new fibre-optic coupled polarization-resolved Raman spectroscopic system was developed for simultaneous collection of orthogonally polarized Raman spectra in a single measurement. An application of detecting incipient dental caries based on changes observed in Raman polarization anisotropy was also demonstrated using the developed fibre-optic Raman spectroscopic system. The predicted reduction of polarization anisotropy in the Raman spectra of caries lesions was observed and the results were consistent with those reported previously with Raman microspectroscopy. The capability of simultaneous collection of parallel-and cross-polarized Raman spectra of tooth enamel in a single measurement and the improved laser excitation delivery through fibre-optics demonstrated in this new design illustrates its future clinical potential.
1. Introduction
Dental caries (i.e. dental decay) is a common chronic infectious oral disease affecting people worldwide. Despite recent research dedicated to developing better methods for detecting dental caries, current clinical practice is still largely limited to conventional visual and visuo-tactile tools such as sharp explorers and dental radiographs. However, these conventional methods which are aimed at detecting cavitated lesions were found to have low sensitivity in detecting early caries lesions [1,2]. For example, dental radiographs are useful in detecting larger, advanced and possibly cavitated dental caries, but limited image resolution and poor radiographic contrast of early carious lesions renders radiographs insensitive for detecting early stage dental caries.
In the last decade, several new caries detection methodologies have emerged. Many of these new developments are spectroscopic or optical imaging based technologies that show promising clinical potential. Digital imaging fibre-optic trans-illumination (DIFOTI) [3], quantitative light-induced fluorescence (QLF) [4], laser-induced fluorescence [5], multi-photon imaging [6], infrared thermography [7], terahertz imaging [8], optical coherence tomography (OCT) [9], Raman spectroscopy [10,11] and NIR trans-illumination imaging [12,13] were all reported as useful in detecting caries lesions. Although some of these research efforts have led to commercial products, such as DIFOTI from Electro-Optical Sciences, Inc., QLF from Inspecktor Research Systems and DIAGNOdent from KaVo, it has also been found that there is a significant learning curve for operators to achieve necessary expertise for clinical use [14]. The sensitivity and specificity of each of these diagnostic tools, however, is less than optimal, leading to some false positives and false negatives.
Raman spectroscopy, a form of vibrational spectroscopy once not considered a viable optical modality for biomedical applications due to its slower speed and the need for powerful excitation sources, is becoming increasingly important in biomedical research for its high biochemical specificity, low water sensitivity and capability to work in the near-infrared (NIR) region with fibre-optics. Recent technological improvements in NIR laser sources and the detector response in the NIR wavelength region also helped the advancement of biomedical Raman spectroscopy.
In previous studies we have reported caries detection methodologies using non-polarized and polarized Raman microspectroscopy [11,15]. Using non-polarized Raman spectroscopy [11], we reported that caries lesions consistently exhibited stronger Raman bands at 431 cm-1, 590 cm-1 and 1043 cm-1 compared with those in the Raman spectra of sound enamel. The Raman band intensity changes in the spectra of caries lesions were proposed to be due to induced structural changes during the caries formation process. Subsequently, further investigation on early caries lesions was carried out with polarized Raman microspectroscopy and it was found that early caries lesions can be differentiated from sound enamel by monitoring the change in polarization anisotropy or depolarization ratio of the most intense Raman band of hydroxyapatite at 959 cm-1. Polarized Raman spectra of caries lesions exhibited a lower degree of Raman polarization anisotropy than those of sound enamel. Such decrease in the Raman polarization anisotropy detected in the Raman spectra of carious lesions is believed to be due to structural changes in the enamel rods and/or increased photon scattering resulting from the larger pores within the caries lesions. Based on the detected differences in the Raman polarization anisotropy between sound and carious enamel, ex vivo caries lesions were detected with 97% sensitivity and 100% specificity based on a Bayesian analysis model [15].
Although these previous studies provided an important methodological foundation for the proposed application, further development is still required to advance this lab-bench study to a portable chair-side dental unit. Considering practical clinical requirements, a fibre-optic coupled Raman probe design would likely be the most appropriate configuration to be used clinically. Therefore, in this study we investigate the possibility of acquiring polarization-resolved Raman spectra of tooth enamel through fibre-optics and discuss the characteristics of a new fibre-optics coupled polarization-resolved Raman spectroscopic system for early caries detection.
In addition to the requirement of measuring polarized Raman spectra through optical fibres, another area of possible improvement on the current technology is to further reduce measurement time so that it becomes more patient-friendly. Previously with a 24 mW excitation power at 830 nm, ∼ 200 sec was required to acquire both orthogonally polarized spectra with good signal-to-noise ratio from a single sampling spot. This lengthy procedure is not desirable in a clinical setting. Theoretically, the measurement time can be reduced in several different ways. The most straightforward method is to increase the laser power because of a linear dependence of Raman signal intensity on the incident laser power. However high laser powers may damage biological tissues due to intense local heating thus limiting our maximum laser power to approximate 100 mW at the sample. The second option is to use a shorter laser wavelength (λex) for excitation because of the inverse dependence of the Raman signal intensity on the fourth power of the excitation wavelength (i.e. signal ∝ 1/λex4). Silicon based CCD detectors also respond more efficiently in the lower wavelength region thus enhancing the detection sensitivity. Although the Raman cross-sections of the detected vibrational modes are higher for shorter excitation wavelength (e.g. 785 nm or 633 nm instead of 830 nm), such wavelengths often generate stronger fluorescence background in the Raman spectra thus hindering the small Raman signals from being observed. This problem is particularly severe for biological tissues due to the presence of many endogenous fluorophores. For tooth enamel, any food debris and extrinsic stains from tobacco usage or other sources also tend to generate strong fluorescence background upon illumination with a shorter-wavelength laser line therefore it is not a preferred alternative for the current application. A third option to improve signal to noise involves re-configuring a conventional single-channel fibre-optic coupled Raman spectroscopic system to collect the two orthogonal components of the polarized Raman spectra simultaneously by using two separate portions on a 2-dimensional (2D) detector to detect each polarization component. This approach was previously reported by Thomson et al [16] in a study to modify a commercial confocal Raman microscope in which a polarization beamsplitter is used to resolve the orthogonal components of Raman spectra. The two spectra were then recorded simultaneously on different locations of the detector. Based on a similar concept, we investigate possible optical configurations for efficient transmission of both laser radiation and polarized Raman signals with fibre-optics. In addition, a special optical coupling between the fibre-optics and a Raman spectrometer will also be presented for simultaneous projection of two orthogonally polarized Raman spectra on the CCD detector.
2. Materials and methods
2.1. Tooth samples
Twenty extracted human premolar teeth were collected at the Oral Surgery Clinic, Faculty of Dentistry, University of Manitoba. These teeth were extracted from consenting patients who were undergoing extractions for orthodontic reasons and the teeth were examined by one dental clinical investigator for signs of early caries at the proximal sites prior to extraction. Remaining soft tissue on extracted teeth was removed by scaling and the samples were thoroughly rinsed with water. Teeth were preserved in sterile filtered de-ionized water until measurement. Each tooth sample was radiographed and independently re-assessed ex vivo by two dental clinical investigators at the University of Manitoba and Dalhousie University. Teeth were used for spectroscopic measurements without further treatment. Spectroscopic measurements on tooth samples were performed under the guidance of the clinical assessments. In total, there were 47 and 27 measurements on sound enamel and carious enamel, respectively.
2.2 Fibre-optic coupled polarized Raman spectroscopic system
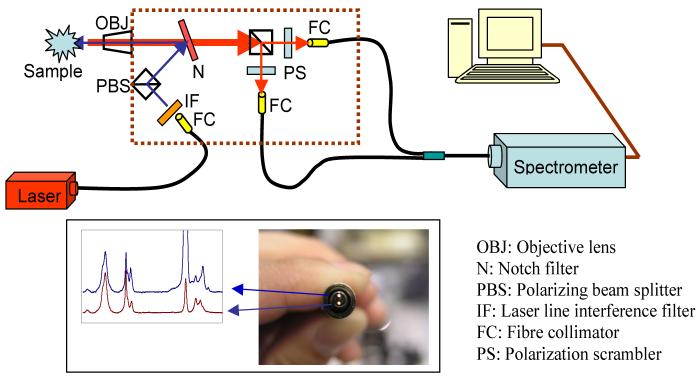
A fibre-optic coupled polarization-resolved Raman spectroscopic system optimized for 830 nm excitation for simultaneous measurements of the parallel- and cross-polarized Raman spectra is illustrated in Fig. 1. The laser source is a 300 mW diode laser (Process Instruments Inc., Salt Lake City, UT, USA) operating at 830 nm and the detection system comprises of an Axial Raman spectrograph (HORIBA Jobin Yvon, Edison, NJ, USA) equipped with a CCD camera (Andor Technologies, South Windsor, CT, USA) operating under the LabSpec software (ver. 4.08). The excitation laser beam is delivered through a 2 m long low-OH multi-mode optical fibre (200 μm core dia. N.A. 0.22, Fiberguide Industries, Stirling, NJ, USA) and the emerging laser light is collimated by a fibre-optic collimator (Thorlabs, Newton, NJ, USA) with matching N.A. to that of the delivery fibre. The collimated light is filtered through a laser bandpass filter (Iridian Spectral Technologies, Ottawa, ON, Canada) to remove unwanted side bands and fibre luminescence. Sequentially the laser light is polarized with a broadband polarizing cube beamsplitter (Newport, Irvine, CA, USA) before it is reflected off an 830 nm notch filter (Iridian Spectral Technologies) to the back aperture of a x40 (N.A. 0.65) microscope objective lens (Newport) which re-focuses the laser beam onto the sample. Raman scattered photons are collected with the same microscope objective lens. Orthogonally polarized Raman signals are separated with a broadband polarizing cube beamsplitter (Newport) placed behind the notch filter. Each polarized beam is transmitted through a depolarizer (CVI Melles Griot, Albuquerque, NM, USA) before entering the collection fiber in order to minimize polarization dependence of the spectroscopic grating. The collection fibre is a custom-made bifurcated fibre bundle (FiberTech Optica, Kitchener, ON, Canada). Each arm of the bifurcated bundle is a 400 μm core diameter fiber (N.A. 0.13) and positioned to collect polarized Raman signals through attached fibre-optic collimators (Thorlabs) with matching N.A. to that of the collection fibres. The Raman signals are then transmitted to the Axial Raman spectrometer (N.A. 0.125) via the common arm of the bifurcated assembly. The spectrometer entrance slit width was set at 192 μm for the optimal combination of signal intensity and spectral resolution. The two fibres transmitting the orthogonally polarized Raman signals are positioned vertically at the distal end of the bifurcated fibre bundle with 1 mm apart from each other in order to minimize spectral cross-contamination between the two orthogonally polarized Raman spectra projected on a 2D CCD detector (see inset in Fig. 1). All spectra were acquired using a 1 sec integration time with 10 acquisitions and 90 mW laser illumination power at the sample. Using microscopic examination, no visible damage was observed on the laser illuminated enamel surfaces at this laser power level. Laser illumination power density should be carefully evaluated for future clinical applications. Parallel-polarized Raman spectra were acquired by binning pixel rows 60-90 on the CCD detector whereas the cross-polarized Raman spectra were acquired by binning pixel rows 115-145 on the same CCD detector.
Fig. 1.
Schematic overview of the developed fibre-optic coupled polarization-resolved Raman spectroscopic system. Inset shows a view of the distal end of the bifurcated fibre bundle. These two fibres transmit orthogonally polarized Raman signals simultaneously and separately. Spectra shown are parallel- and cross-polarized Raman spectra of sound enamel.
2.3 Data analysis
While the system’s optics background was subtracted from each individual spectrum, no baseline correction was necessary as all the spectra acquired were relatively free of strong fluorescence interference. Instrument response correction was performed according to procedures outlined previously with a reference NIST traceable tungsten halogen lamp (The Eppley Laboratory, Inc., Newport, RI, USA) of known temperature. The depolarization ratio ρ959 and polarization anisotropy A959 were calculated according to definitions used previously [15]:
| (1) |
| (2) |
where I959(⊥) and I959(∥) are the integrated peak intensities of the 959 cm-1 peak detected in the cross-polarized and parallel-polarized Raman spectra, respectively.
For statistical analyses, ρ959 values were calculated for 2 data groups, ρ959(C) for caries lesions and ρ959(S) for sound enamel. A simple t-test was carried out using the t-critical value at 99.9% confidence interval level with N1+N2-2 degrees of freedom to determine if there is a significant difference between these two data groups, where N1=47 and N2=27 were the number of measurements for sound enamel and caries lesions, respectively, acquired from 20 teeth. A similar statistical analysis was also performed for anisotropy, A959(C) for caries lesions and A959(S) for sound enamel.
Estimates of sensitivity and specificity of the current method for early caries detection were calculated based on a Bayesian analysis model. Threshold values of depolarization ratio and polarization anisotropy to distinguish carious enamel from sound enamel were first estimated using normal distribution plots produced based on experimentally determined mean and standard deviation values for caries lesion and sound enamel. Once the threshold depolarization ratio and polarization anisotropy values were determined, each experimental ρ959 and A959 was then compared with these threshold values to determine the numbers of true-positive (TP), false-positive (FP), false-negative (FN) and true-negative (TN). Sensitivity and specificity were calculated as TP/(TP+FN) and TN/(TN+FP), respectively.
3. Results
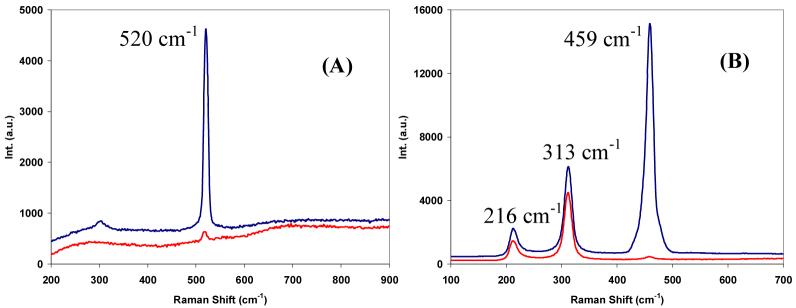
Polarized Raman spectra of silicon wafer and carbon tetrachloride were first recorded with the system to evaluate its performance. A strongly polarized Si-O vibration band at 520 cm-1 was observed for silicon wafer (Fig. 2(A)) indicating good accuracy and efficiency of polarization intensity measurements using the developed fibre-optic based system. Similarly, in Fig. 2(B), two orthogonally polarized Raman spectra of carbon tetrachloride showed a strongly polarized band at 459 cm-1 and two depolarized bands at 313 cm-1 and 216 cm-1, respectively. For measuring Raman spectra of carbon tetrachloride, it was found that the x40 objective lens used for acquiring the Raman spectra of tooth and silicon wafer was not practical due to the objective’s limited working distance. Such small working distance made it difficult to focus the laser beam past the sample cuvette wall. Therefore, all the polarized Raman spectra shown in Fig. 2(B) were acquired using a x10 objective lens (Newport) with a 16.5 mm focal length.
Fig. 2.
Representative parallel- (upper trace) and cross-polarized (lower trace) Raman spectra of (A) Si wafer acquired with a x40 objective lens and (B) CCl4 acquired with a x10 objective lens. Spectra were slightly offset for clarity.
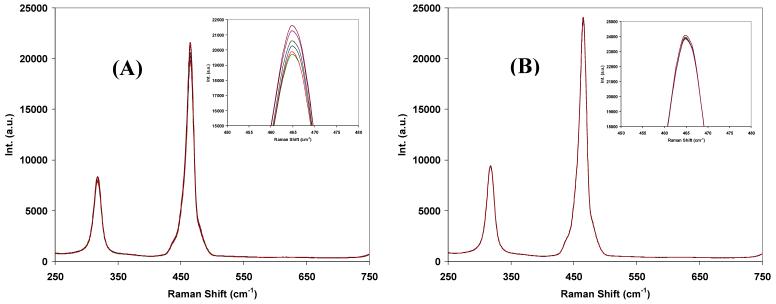
Although multi-mode fibres are known to scramble the polarization while transmitting light, our experiments detected residual polarization dependent response after the Raman signal was transmitted via a 1.5 m long multi-mode fibre as evidenced in Fig. 3(A). In this test, a λ/2 waveplate replaced the polarization scrambler in the setup depicted in Fig. 1 then spectra were taken with rotation of the λ/2 waveplate to change the polarization direction of the incoming Raman photons. Figure 3(A) shows how the intensity of the 459 cm-1 band of carbon tetrachloride changes with varying polarization of the Raman signal. When the polarization scrambler was added back into the Raman collection path after the λ/2 waveplate, such polarization dependence disappeared even with varying polarization of incoming Raman signal (Fig. 3(B)). Therefore, in order to effectively remove such polarization dependence of the spectrometer, two polarization scramblers were placed permanently in both polarization channels of the Raman collection optics-see Fig. 1.
Fig. 3.
Spectra acquired from the fibre-optic coupled Raman system as a function of the Raman signal’s polarization state (A) before and (B) after a polarization scrambler was inserted into the Raman collection path in between the collection PBS and the collection fibre. Spectra shown are parallel-polarized Raman spectra of CCl4. Variation of the Raman signal polarization state was achieved by rotating a λ/2 plate placed immediately after the PBS in the Raman collection path.
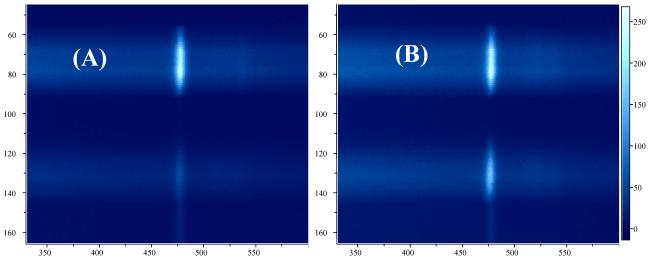
Representative parallel-polarized and cross-polarized Raman spectra of sound enamel and caries lesions acquired with the fibre-optic based system are shown in Fig. 4. Raman spectra of sound enamel acquired with the fibre-optic coupled system also show high degree of polarization anisotropy (Fig. 4(A)) consistent with our previous observations using Raman microspectroscopy. Raman peaks at 431 cm-1, 590 cm-1, 609 cm-1, 959 cm-1 and 1070 cm-1 all decrease in intensity in the cross-polarized Raman spectra of sound enamel compared to those measured in the parallel-polarized arrangement. Especially noticeable is the intensity variation of the symmetric P-O stretching vibration band at 959 cm-1. On the contrary, the polarization anisotropy detected in the polarized Raman spectra of caries lesions is much weaker as illustrated in Fig. 4(B). The representative CCD images where the two orthogonally polarized Raman spectra were obtained are presented in Fig. 5 with Fig. 5(A) highlighting the 959 cm-1 band for the sound enamel and Fig. 5(B) the same Raman band for caries lesions.
Fig. 4.
Representative parallel- (upper trace) and cross- (lower trace) polarized Raman spectra of (A) sound enamel (B) caries lesions acquired with the developed system. Spectra were offset for clarity.
Fig. 5.
Representative CCD image read-outs of the Raman spectra of (A) sound enamel and (B) caries lesions containing both parallel- (upper channel) and cross- (lower channel) polarized components. Only the area on the CCD detector containing the Raman band at 959 cm-1 was shown.
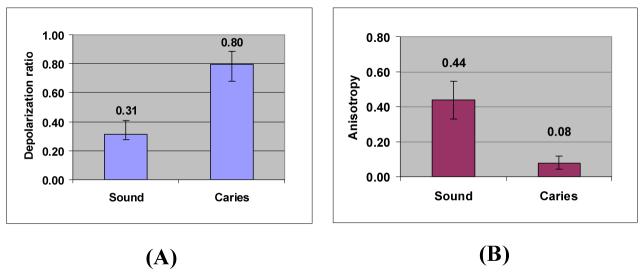
In order to evaluate the significance in the difference of ρ959 and A959 found in the polarized Raman spectra between sound and carious enamel, a t-test was performed based on 47 ρ959 / A959 values obtained from the spectra of sound enamel and 27 ρ959 / A959 values obtained from those of caries lesions. Figures 6(A) and 6(B) illustrate the mean ± standard deviation values of ρ959 and A959 for both sound and carious enamel in bar-graphs. Statistical analyses resulted in a mean ρ959(S) of 0.31±0.10 and a mean A959(S) of 0.44±0.11 for sound enamel, along with a mean ρ959(C) of 0.80±0.09 and a mean A959(C) of 0.08±0.04 for caries lesions. A t-test performed at 99.9% confidence interval indicates that the differences in ρ959 and A959 between sound enamel and caries lesion are statistically significant with p < 0.001 for both ρ959 and A959. For estimating the sensitivity and specificity of the proposed methodology, experimental depolarization ratio data were compared with the threshold depolarization ratio value for distinguishing sound enamel from carious enamel. Assuming normal distribution, threshold values of depolarization ratio at 0.56 and polarization anisotropy value at 0.19 were identified using the normal distribution plots generated from experimental data. Of the measurements obtained from sound enamel, 1 data point was identified as carious, i.e. 1 false-positive (FP) was identified. No false-negatives (FN) were identified for the carious enamel tests. This Bayesian analysis results in a sensitivity of 100% and specificity of 98% for the methodology based on both depolarization ratio and polarization anisotropy of the 959 cm-1 band obtained by fibre-optic measurements. This result is consistent with our previous analysis obtained from the Raman microspectroscopic study on caries detection.
Fig. 6.
Bar graphs of (A) depolarization ratio (ρ959) and (B) polarization anisotropy (A959) obtained from sound enamel versus carious lesion. Mean +/- standard deviation values are shown. N=47 and N=27 for sound enamel and caries lesion, respectively.
4. Discussion
Following up on our previous efforts in evaluating the strength of polarized Raman spectroscopy for dental caries detection, in this study we investigated the performance of a fibre-optic coupled Raman spectroscopic system for obtaining similar polarization information. Although being a proof-of-concept study, the outcome of this study is significant because demonstration of efficient collection of Raman polarization data through fibre-optics can greatly facilitate further development of this technology into a clinical device which will largely rely on fibre-optics to transmit polarized laser beam and polarization-resolved Raman signals.
The first challenge to be overcome was to transmit the laser radiation through an optical fiber while maintaining adequate excitation power and its polarization. One possible solution to these requirements is to use a single-mode polarization-maintaining (PM) fibre to transmit the laser. However, PM fibres are normally very small in diameters (e.g. less than 10 μm) thus making optical coupling between the free-space laser beam and the small fibre not particularly efficient especially when trying to couple a rather large laser beam (∼ 0.5mm) from our existing laser source. Another approach of transmitting polarized laser beam to the sample via fibre-optic involves using a linear polarizing filter. This polarizing filter can be placed after the optical fiber to control the polarization of the emerging light, yet this filter also introduces dramatic power losses. An experiment was performed using this polarizing filter arrangement and the power loss after the filter was found to be around 75% of the incoming laser power. Instead, a design based on a polarizing beamsplitter (PBS) better preserved laser power by polarizing a highly depolarized light emerging from the optical fibre into two orthogonally polarized rays. One ray exiting the PBS at a 90° angle to the incident light was used as the excitation beam for measurements and the other ray was discarded into a beam dump. The power at the sample was increased from ∼ 25 mw to 90 mw compared to the polarizing filter based approach. With this additional laser irradiation power, faster measurements became possible.
In our previous Raman microspectroscopic studies, we reported that the Raman spectroscopic data acquired with an x10 objective lens gave the best contrast between sound and carious enamel due to its optimal sampling depth at ∼ 200 μm in tooth enamel and this depth is comparable to the typical depth of a surface carious lesion. In the current work, however, such high spectral contrast between carious and sound enamel was not detected in the spectra acquired using x10 objective lens with lower N.A. (N.A.0.25). Objective lens with higher N.A.s, such as the x40 (N.A.0.65) and x50 (N.A.0.75) objective lens, on the other hand, gave better spectral contrast between sound and carious enamel. This difference between the microspectroscopic and the fibre-optic coupled systems can be attributed to the different laser optics in the 2 systems. For example, in the microspectroscopic system, the laser spot size under a x10 objective lens was measured to be ∼20 μm whereas an x40 objective lens in the fibre-optic setup gave a much wider laser spot close to 200 μm. Such a large increase in the laser spot size with the fibre-optic setup suggested that a much larger volume of the tooth enamel was being interrogated. Since the Raman photons originating from the deeper region of the interrogated volume travel a longer distance before emerging from the tooth surface, it is more likely for these Raman photons to undergo more scattering events before reaching the collection lens thus losing more of their initial polarization. This polarization scrambling effect becomes increasingly dominant with increasing sampling depth, or decreasing N.A. of the objective lens as shown in Fig. 7. Each panel in Fig. 7 shows a pair of the orthogonally polarized Raman spectra of sound enamel collected with a x10 (N.A.0.25), x20 (N.A. 0.50) and x50 (N.A. 0.75) objective lens. A trend of increasing polarization scrambling with decreasing magnification power (or decreasing N.A.) can be seen clearly. Although higher N.A. objective lens was reported to show depolarizing effect [17], it is probably small in this case compared to the polarization scrambling effect caused by multiple scattering events within a highly scattering material such as tooth enamel. Despite providing the greatest spectroscopic contrast between sound and carious enamel, the x50 objective lens was not chosen for the current study due to its extremely small working distance. Instead, a x40 objective lens was used because it provided a slightly larger working distance with little loss of discrimination between sound and carious enamel. The correlation between the laser optics and sampling volume need to be carefully evaluated in the further development of a Raman fibre-optic probe for the detection of dental caries.
Fig. 7.
Orthogonally polarized Raman spectra of sound enamel acquired with (A) x10, N.A.=0.25 (B) x20, N.A.=0.50 and (C) x50, N.A.=0.75 objective lens. Only the spectral region between 700 cm-1 and 1300 cm-1 was shown. Increased spectral contrast between the parallel- and cross-polarized Raman spectra of sound enamel was demonstrated with increasing objective lens magnification power with increasing N.A.
The data presented demonstrates that polarized Raman spectra of tooth enamel can be measured with high accuracy using a fibre-optic coupled Raman spectroscopic system. Both ρ959 and A959 obtained in this study can be used to differentiate early caries from sound enamel. It was also demonstrated that the current fibre-optic based system provides a similar level of spectroscopic contrast to that obtained with Raman microspectroscopy. Although both the fiber-optic coupled system and Raman microspectroscopy record higher ρ959 values for carious lesions compared to sound enamel, the ρ959 values of carious lesions and sound enamel obtained with the fibre-optic system were found to be higher than their respective values obtained previously with the microspectroscopic system. This difference can be attributed to the different properties of the lasers employed in both systems as well as the different optics used in the two systems. The microscopic system used previously better preserves the polarization properties of the beam compared to the fibre-optic setup due to the smaller laser beam size and smaller sampling volume. Although this difference in the optics does not undermine the utility of using polarized Raman measurements to detect early caries lesions, it underlines the importance of standardizing the optical platform of any future clinical device in order to maintain high inter-system consistency between the data.
In summary, we report a fibre-optic coupled polarized Raman spectroscopic study of dental caries. Combining multi-mode optical fibers and polarizing beamsplitters, efficient transmission of polarized laser radiation to the sample and simultaneous collection of orthogonally polarized Raman spectra of tooth enamel using a single CCD array detector were achieved. Caries lesions can be detected based on a reduced Raman polarization anisotropy or a higher depolarization ratio of the 959 cm-1 peak derived from polarized Raman spectra collected through fibre-optics. Bayesian analyses of the data result in 100% sensitivity and 98% specificity for the methodology based on changes in polarization anisotropy of the 959 cm-1 band obtained by fibre-optic measurements. Such high sensitivity and specificity are consistent with those reported in our previous microspectroscopic study thus making the fibre-optic approach a viable option for conducting polarized Raman spectroscopic studies in vivo. A new probe development based on the proposed technology is currently underway to improve in vivo access to tooth surfaces, including the interproximal surfaces. Results from this investigation will be reported later.
Acknowledgments
This research project is supported partially by grants from the Canadian Institutes of Health Research-Institute of Musculoskeletal Health and Arthritis and the US National Institutes of Health-National Institute of Dental and Craniofacial Research (Grant No. R01DE017889). We would also like to thank the Graduate Orthodontic Program and the Oral Surgery Clinic at the Faculty of Dentistry, University of Manitoba for assisting in collection of teeth for this study. We also like to thank Dr. Dan Popescu for useful discussion on polarization optics.
References and links
- 1.Bader J. Diagnosis and management of dental caries. 36. Agency for Healthcare Research and Quality; Rockville, MD: Feb, 2001. AHRQ Publication No.01-E055. [Google Scholar]
- 2.Ismail AI. Visual and Visuo-tactile detection of dental caries. J. Dent Res. 2004;83:C56–C66. doi: 10.1177/154405910408301s12. [DOI] [PubMed] [Google Scholar]
- 3.Schneiderman A, Elbaum M, Schultz T, Keem S, Greenebaum M, Driller J. Assessment of Dental caries with Digital Imaging Fiber-Optic Transillumination (DIFOTI): in vitro study. Caries Res. 1997;31:103–110. doi: 10.1159/000262384. [DOI] [PubMed] [Google Scholar]
- 4.de Josselin de Jong E, Sundström F, Westerling H, Tranaeus S, ten Bosch JJ, Angmar-Månsson; B. A New Method For In Vivo Quantification Of Changes In Initial Enamel Caries With Laser Fluorescence. Caries Res. 1995;29:2–7. doi: 10.1159/000262032. [DOI] [PubMed] [Google Scholar]
- 5.Stookey GK, Jackson RD, Zandona AG, Abaloui M. Dental caries diagnosis. Dent. Clin. North Am. 1999;43:665–677. [PubMed] [Google Scholar]
- 6.Girkin JM, Hall AF, Creanor SL. Two-photon imaging of intact dental tissue. Dental Caries. 2000;2:317–325. [Google Scholar]
- 7.Kaneko K, Matsuyama K, Nakashima S. In: Stookey GK, editor. Quantification of early carious enamel lesions by using an infrared camera in vitro; Proceedings of the 4th annual Indiana conference; Indiana University School of Dentistry; Indianapolis, Indiana. 1999.pp. 83–100. [Google Scholar]
- 8.Crawley DA, Longbottom L, Cole BC, Ciesla CM, Arnone D, Wallace VP, Pepper M. Tetrahertz pulse imaging: a pilot study of potential applications in dentistry. Caries Res. 2003;37:352–359. doi: 10.1159/000072167. [DOI] [PubMed] [Google Scholar]
- 9.Amaechi BT, Higham SM, Podoleanu AG, Rogers JA, Jackson DA. Use of optical coherence tomography for assessment of dental caries: quantitative procedure. J. Oral Rehabil. 2001;28:1092–1093. doi: 10.1046/j.1365-2842.2001.00840.x. [DOI] [PubMed] [Google Scholar]
- 10.Hill W, Petrou V. Caries detection by diode laser Raman spectroscopy. Appl. Spectrosc. 2000;54:795–799. [Google Scholar]
- 11.Ko AC-T, Choo-Smith LP, Hewko M, Leonardi L, Sowa MG, Dong CCS, Williams P, Cleghorn B. Ex vivo detection and characterization of early dental caries by optical coherence tomography and Raman spectroscopy. J. Biomed. Opt. 2005;10:031118. doi: 10.1117/1.1915488. [DOI] [PubMed] [Google Scholar]
- 12.Jones RS, Huynh GD, Jones GC, Fried D. Near-infrared transillumination at 1310-nm for the imaging of early dental decay. Opt. Express. 2003;11:2259–2265. doi: 10.1364/oe.11.002259. [DOI] [PubMed] [Google Scholar]
- 13.Bühler CM, Ngaotheppitak P, Fried D. Imaging of occlusal dental caries (decay) with near-IR light at 1310-nm. Opt. Express. 2005;13:573–582. doi: 10.1364/opex.13.000573. [DOI] [PubMed] [Google Scholar]
- 14.Stookey GK. Optical Methods—Quantitative Light Fluorescence. J. Dent. Res. 2004;83:C84–C88. doi: 10.1177/154405910408301s17. [DOI] [PubMed] [Google Scholar]
- 15.Ko AC-T, ChooSmith L-P, Hewko M, Sowa MG, Dong CCS, Cleghorn B. Detection of early dental caries using polarized Raman spectroscopy. Opt. Express. 2006;14:203–215. doi: 10.1364/opex.14.000203. [DOI] [PubMed] [Google Scholar]
- 16.Thomson GA, Baldwin KJ, Batchelder DN. Raman spectroscopy with simultaneous measurement of two orthogonally polarized Raman spectra. J. Raman Spectrosc. 2003;34:345–349. [Google Scholar]
- 17.Bremard C, Dhamelincourt P, Laureynes J, Turrell G. The effect of high-numerical-aperture objectives on polarization measurements in micro-Raman spectrometry. Appl. Spectrosc. 1985;39:1036–1039. [Google Scholar]


