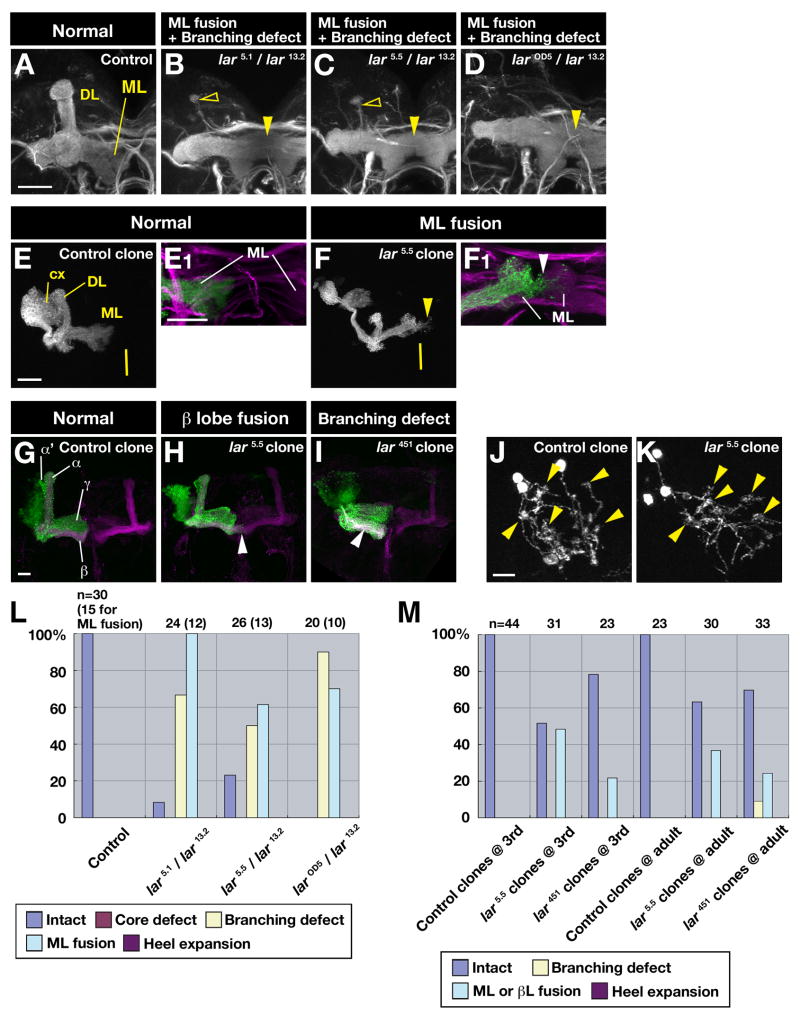
FIG. 5. Lar MB phenotypes: medial lobe fusion and branching defects.
(A–D) Third instar larval brain hemispheres stained with anti-FasII to reveal MB morphologies. Reconstructions of optical sections are shown. Open arrowheads indicate dorsal lobes (DL); closed arrowheads indicate medial lobes (ML). (A) Wild-type control. (B) Lar5.1/Lar13.2 transheterozygote. One DL is thin and the other absent, and the MLs are fused across the midline. (C) Lar5.5/Lar13.2 transheterozygote. Same phenotype as in (B). (D) LarOD5/Lar13.2 transheterozygote. Both DLs are absent and the MLs are fused. (E–I) MARCM NB clones (positively labeled with mCD8-GFP), examined at third-instar larval stage (E–F) or in adults (G–I). GFP signal is in green, and anti-FasII in magenta, in (E1) and (F1), which are higher-magnification views; (E) and (F) show the GFP signal alone, in white. The brain midline is indicated by a yellow vertical bar in (E) and (F). (E, E1): control clone, showing the calyx (CX), DL, and ML. Note that the end of the ML portion of the clone is to the left of the brain midline. (F,F1): Lar5.5 clone. Note that the ML axons extend beyond the brain midline (arrowheads), and enter the contralateral ML lobe (arrowhead in F1). (G–I) Adult clones, visualized with mCD8-GFP (green) and anti-FasII (magenta). (G) Control clone. The α, α′, β, and γ lobes are indicated. (H) Lar5.5 clone. Note that some β lobe axons (arrowhead) extend across the brain midline and contact the contralateral anti-FasII-stained β lobe. (I) Lar451 clone. The α lobe portion of the clone is missing, and the β lobe is doubled in thickness (arrowhead), indicating a defect in branching. (J–K): single cell/two-cell MARCM clones, showing dendritic endings in the calyx. The dendrites end in “claw-like” terminals (arrowheads). (J) Control clone. (K) Lar5.5 clone. No obvious difference in morphology of the dendritic endings is seen. (L) Bar graph of phenotypic penetrances in Lar mutant larvae. Note that the bar height for ML fusion indicates the % of brains affected, while those for other phenotypes indicate the % of MBs affected. (M) Bar graph of phenotypic penetrances in Lar mutant NB clones examined at the larval or adult stages. Bar in (A), 20 μm: applies also to (B–D); bar in (E), 20 μm: applies also to (F); bar in (E1), 20 μm: applies also to (F1) ; bar in (G), 20 μm: applies also to (H–I); bar in (J), 10 μm: applies also to (K).

