
Fig. 4. Pam regulates mTOR signaling through TSC2 downregulation in rat neurons.
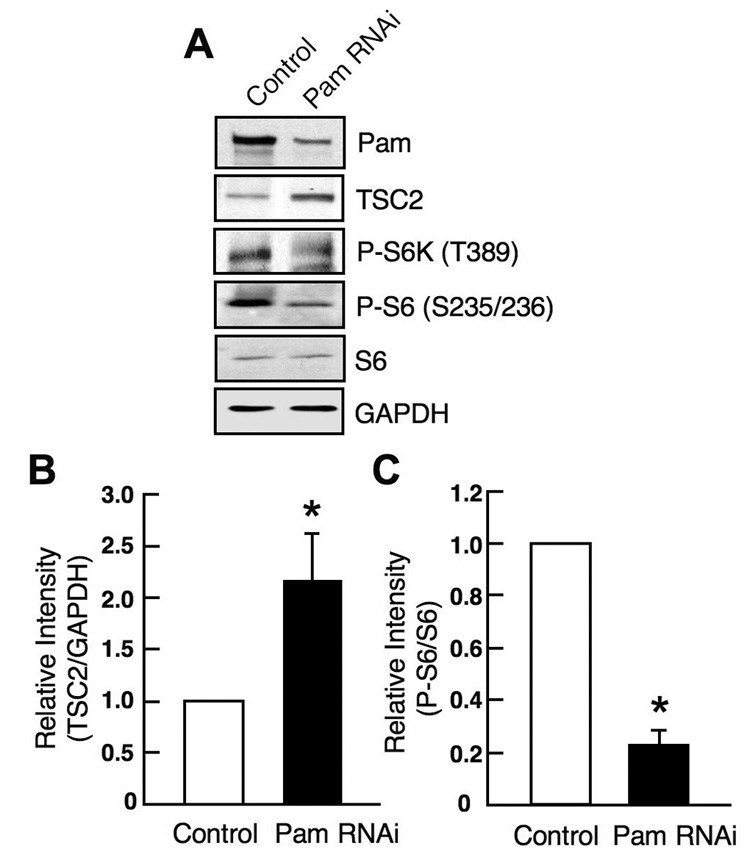
(A) Pam RNAi in rat cerebral cortical neurons resulted in an increase of TSC2 levels and subsequent downregulation of P-S6 and P-S6K levels. Dissociated cortical neuronal cells (5 DIV) from E18 rat were infected with lentiviruses expressing either control or Pam RNAi. At 9 DIV, cell lysates were prepared and analyzed by western analysis. (B) Quantitation of TSC2 levels in control and Pam RNAi groups (mean ± SEM; n=3, t-test, *p<0.05). Band intensities from western blots were analyzed using scanned images by densitometer (Bio-Rad). TSC2 levels were normalized against GAPDH levels. (C) Quantitation of P-S6 levels in control and Pam RNAi groups (mean ± SEM; n=3, t-test, *p<0.05). Band intensities were analyzed as described in B. P-S6 levels were normalized against total S6 levels.