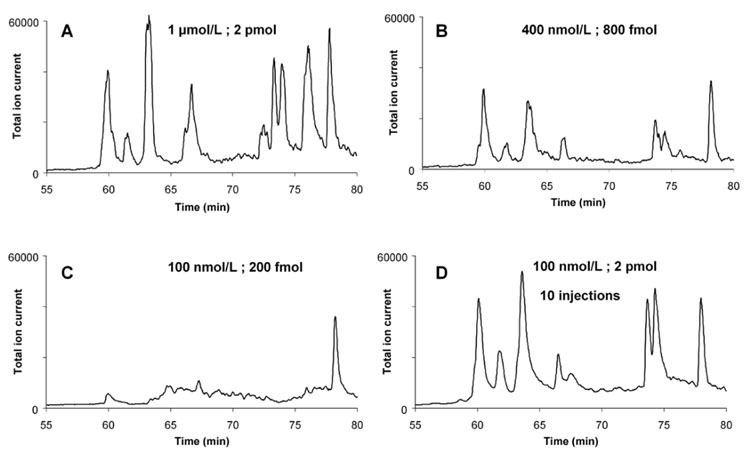
Figure 7.
Comparison of digestion/separation using myoglobin solutions with different concentration or different injected volume. Injection volume 2 µL; concentration 1 µmol/L (2 pmol injected) (A) , 400 nmol/L (800 fmol) (B), 100 nmol/L (200 fmol) (C); Ten successive injections of 2 µL of 100 nmol/L (2 pmol) myoglobin solution (D). For other conditions see Figure 4.

