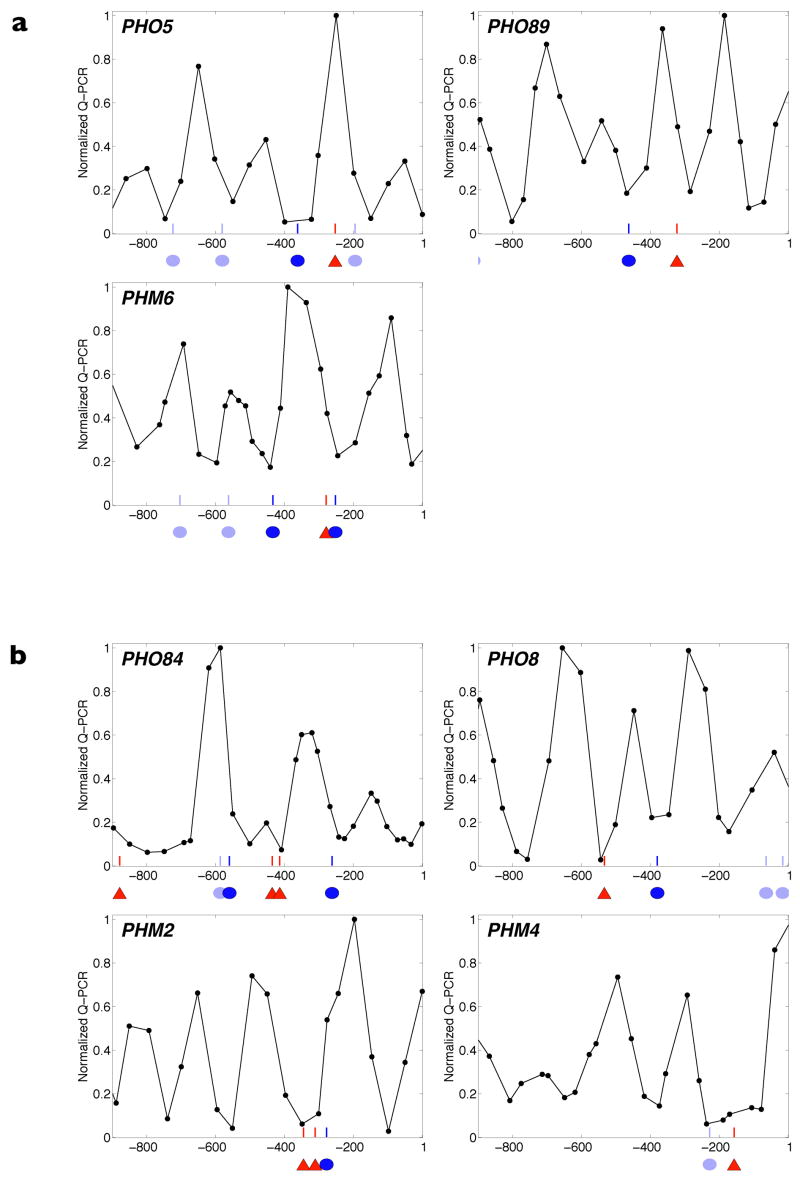
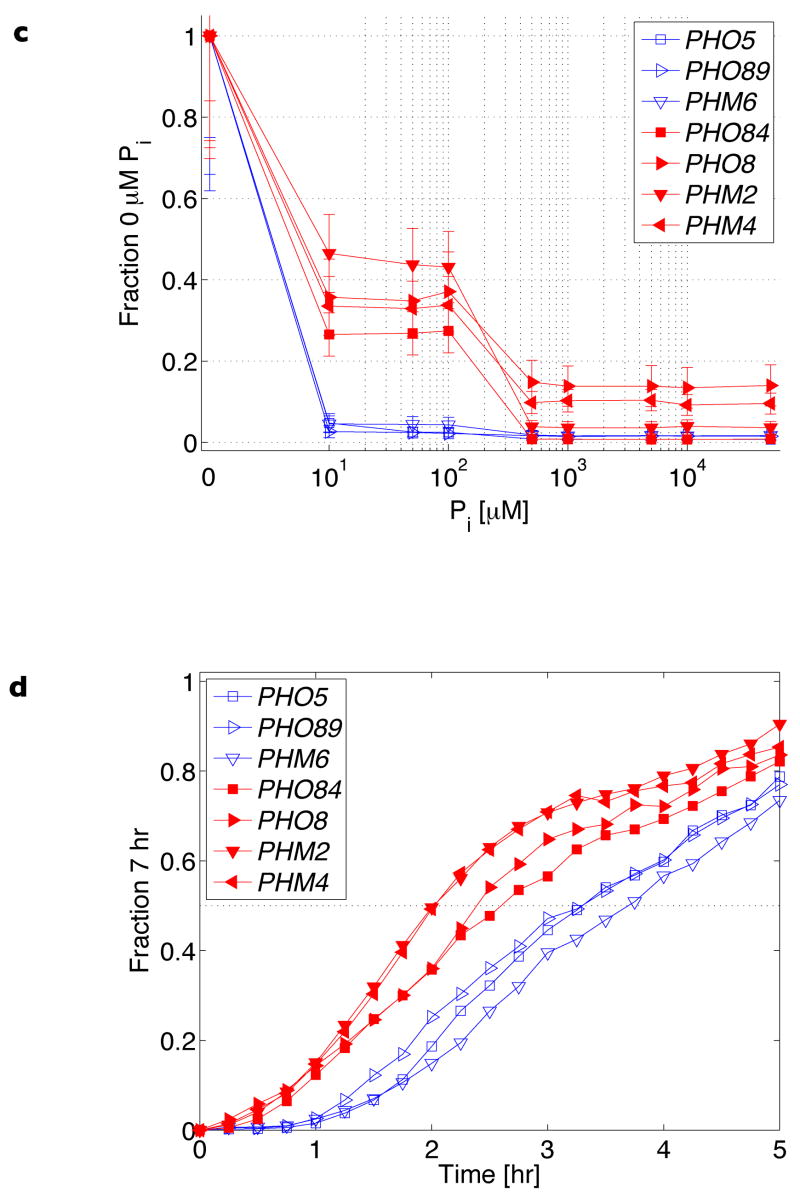
Figure 2. Promoter architecture and quantitative expression behaviour of representative PHO genes.
a, b, Promoter architecture schematized by superimposing nucleosome positions measured in repressing (10 mM Pi) conditions onto Pho4-binding sites identified through bioinformatic analysis (Supplementary Fig. 4). Red triangles represent evolutionarily conserved high-affinity motifs (CACGTG consensus), dark-blue ovals represent evolutionarily conserved low-affinity motifs (deviations from the high-affinity motif), light-blue ovals represent low-affinity motifs that are not evolutionarily conserved (Supplementary Fig. 5), and the x axis units reference promoter coordinates with respect to translation start (ATG = 1). In a are PHO promoters with an accessible low-affinity Pho4 site; in b are promoters with at least one accessible high-affinity Pho4 site. c, Steady-state transcriptional response of PHO target genes to Pi. Error bars are interquartile ranges (see Fig. 1b). d, Induction kinetics in Pi starvation.


