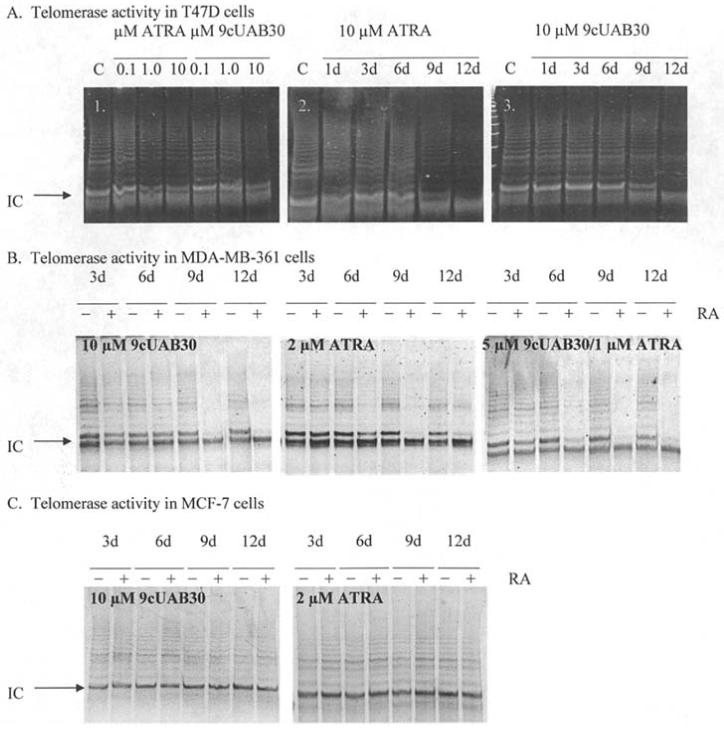
Figure 4.

Analysis of telomerase activity in breast cancer cells in response to retinoids. (A1) Dose-responsive inhibition of telomerase activity with ATRA and 9cUAB30. DNA products from the TRAP assay are presented for samples treated with 0.1, 1, and 10 μM ATRA or 9cUAB30 for 6 days of concurrent treatment. (A2) Inhibition of telomerase over 12-day treatment with 10 μM ATRA. TRAP assay results are presented for T47D breast cancer cells exposed to 10 μM ATRA for 12 days of concurrent treatment. (A3) Inhibition of telomerase over 12 days of treatment with 9cUAB30. C, untreated control cell samples. (B) Retinoid-induced down-regulation of telomerase activity in MDA-MB-361 cells. Cells were treated with 10 μM 9cUAB30, 2 μM ATRA, or a combination of 5 μM 9cUAB30 and 1 μM ATRA. (C) Telomerase activity in MCF-7 cells following treatment with retinoids. Treatments were 10 μM 9cUAB30 or 2 μM ATRA. +, treated samples; and -, untreated samples. In all gels shown a 61-bp internal control (IC) included in the reaction mixture for TRAP assays was used to standardize loading. The ladder formed above the IC represents 6-bp increments of TTAGGG telomeric repeats. The height of the ladder formed and the intensity of fluorescence are proportional to telomerase activity in the sample.
