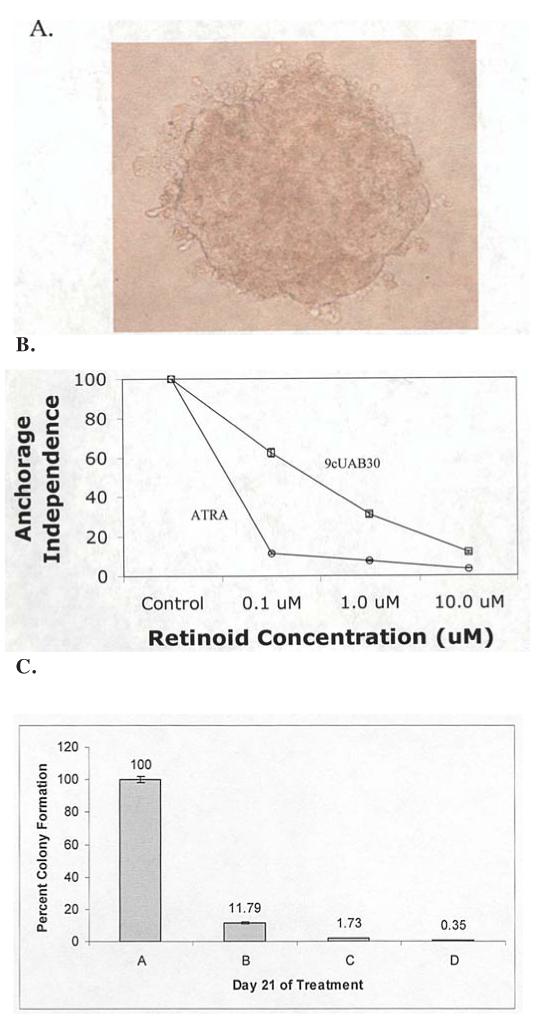
Figure 5.

Soft agar analysis of retinoid-treated T47D and MDA-MB-361 cells. (A) Representative photograph of an MDA-MB-361 colony of greater than 25 cells that were counted at each time point taken at x400 magnification. (B) Examination of contact inhibition growth requirements was performed using soft agar analysis in untreated control T47D cells and cells exposed to 0.1, 1.0, or 10.0 μM ATRA or 9cUAB30 for 28 days. Colony counting results for both groups are summarized as a percent of untreated control cell colony counts. (C) Levels of tumorigenicity of MDA-MB-361 cells following 10 μM 9cUAB30 (green horizontal stripes), 2 μM ATRA (red diagonal stripes), and 5 μM 9cUAB30 and 1 μM ATRA combination (yellow dots) treatments compared to untreated MDA-MB-361 cells (blue vertical stripes). Level of tumorigenicity is expressed as a ratio of the percentage of treated colonies to the number of untreated colonies.
