
Fig. 3.
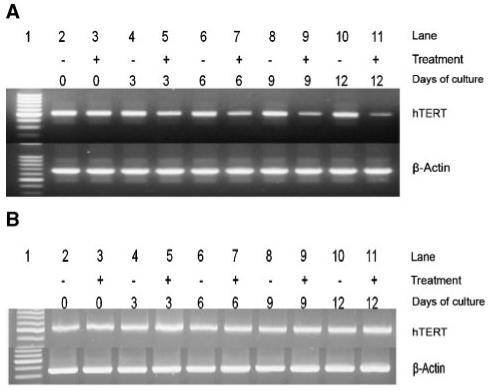
EGCG down-regulates hTERT mRNA expression in MCF-7 cells but not in HL60 cells. Both untreated and cells treated for specific time intervals were assayed for hTERT expression. A: hTERT mRNA expression in treated MCF-7 compared side-by-side with untreated controls and (B) treated HL60 cells presented in a similar fashion. Lane 1 contains 100 bp marker. (+) Denotes cells treated with either 50 μM (for HL60 cells) or 100 μM EGCG (for MCF-7 cells) based on dose response analysis (data not shown) and (-) indicates untreated controls. β-Actin was used as a loading control. For PCR amplification of hTERT, primers used were as follows: 5′-AGAACGTTCCGCAGAGAAAA-3′, sense and 5′-AAGCGTAGGAAGACGTCGAA-3′, anti-sense. Amplification of β-actin was accomplished using primers as follows: 5′-AGAAAATCTGGCACCACACC-3′, sense and 5′-AGCACTGTGTTGGCGTACAG-3′, antisense.