
Figure 4. Functional profiling of the Disease-specific genes: Gender specific effects of PD.
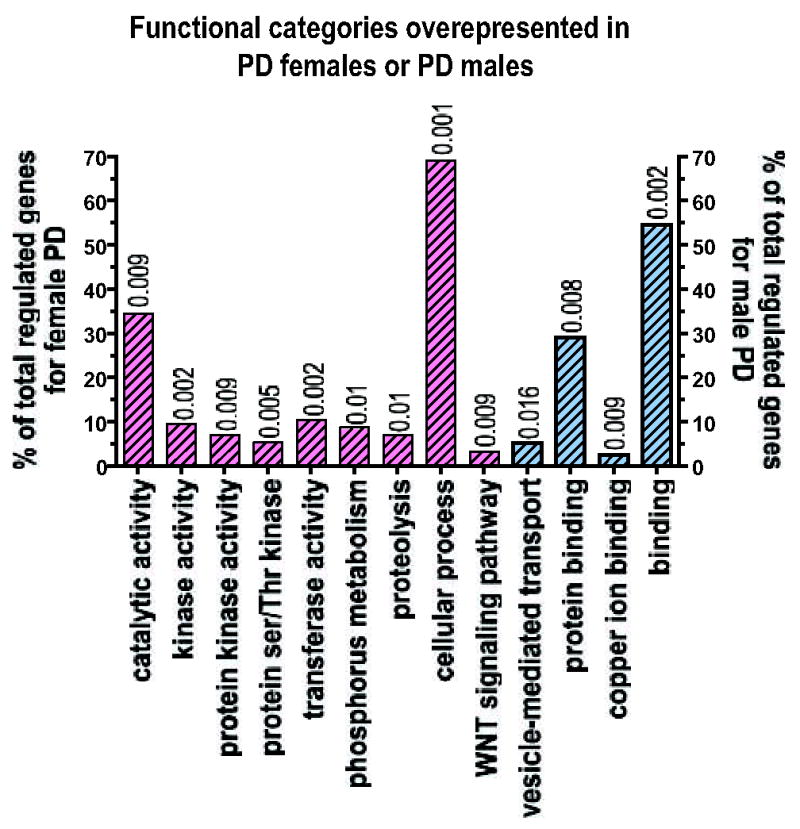
To analyze the functional categories associated with PD females or PD males compared to their respective controls using the Gene Ontology Database with a process similar to that used for the gender-independent genes, we used only probe-sets with a multiclass q value<0.11), i.e. 269 probe-sets out of 289 for the females with PD and 198 probe-sets out of a total of 292. The figure shows the categories for the biological processes and molecular function identified as significant (p <0.01, # genes in category ≥3% of total regulated genes). The pink bars with diagonal bands represent the categories associated with female PD and the light blue bars with diagonal bands represent the functional categories associated with male PD. The complete list of genes regulated in female PD with respect to female controls can be found as supplementary Table 3 and the complete list of genes regulated in male PD with respect to male controls can be found as supplementary Table 4. In this figure we show all of the functional categories that are significantly different according to our method. We show both more specific and informative categories such as ‘ubiquitin cycle’ and more broad categories such as ‘cellular process’. Cellular process in only one of eighteen different sub-categories under the parent term ‘biological process’. Some of the categories at the same hierarchical level as ‘cellular process’ are ‘biological adhesion’, ‘reproductive process’ or ‘response to stimulus’ (to search categories and their meaning and hierarchical relationship see QuickGO: http://www.ebi.ac.uk/ego/).