
Figure 3.
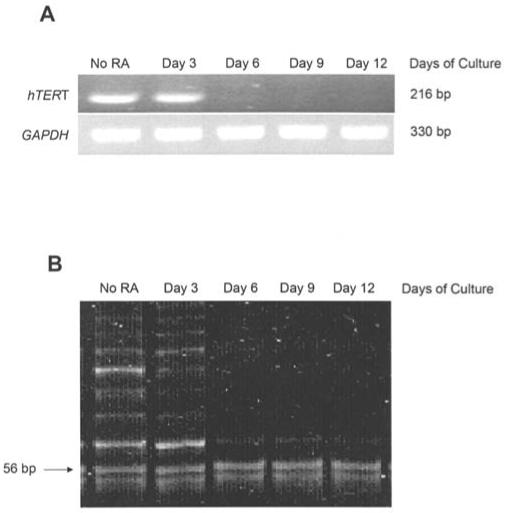
Changes in hTERT gene expression and telomerase activity following ATRA treatment. (A) hTERT RT-PCR analysis of HL60 cells treated with 2 μM all-trans retinoic acid (ATRA). hTERT cDNA was visualized as a band at 216 bp. These findings are representative of triplicate gels from three individual experiments. (B) Telomerase activity determined using the telomere repeat amplification protocol (TRAP). The laddering is a telomerase-positive result. The 56-bp band served as an internal control for the assay. This gel is representative of triplicate gels from three individual experiments.