
Figure 4.
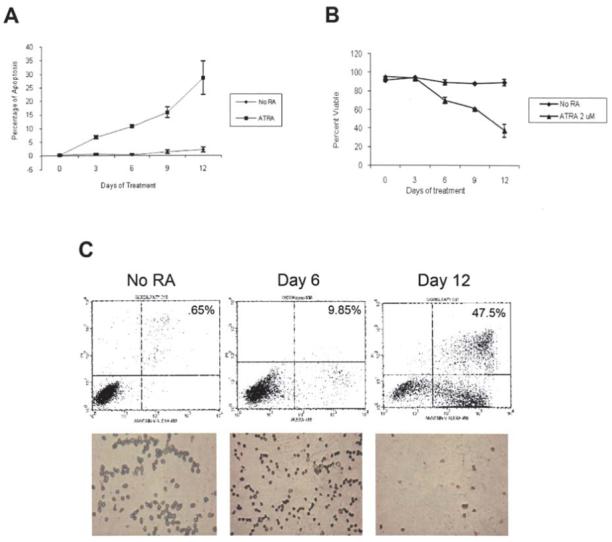
Cell viability and apoptosis in response to ATRA treatment. (A) Summary graph of all-trans retinoic acid (ATRA)-induced apoptosis. Percentage of apoptosis determined by Apoptag® Apoptosis assay for HL60 cells treated with 2 μM ATRA. (B) Effects of 2 μM all-trans retinoic acid on HL60 cell viability. Cells were counted on a hemocytometer after trypan blue exclusion staining. Bars represent standard error of the mean from three separate experiments. (C) Fluorescence-activated cell sorting (FACS) analysis of apoptosis after staining with Annexin V-conjugated Alexafluor-488 and propidium iodide. The lower right quadrants contain apoptotic cells. The values indicate representative percentages of apoptosis taken from three separate experiments. Analysis of apoptosis was determined by Apoptag® Apoptosis assay for HL60 cells treated with 2 μM all-trans retinoic acid (ATRA). Brown cells are apoptotic and green cells negative for apoptosis.