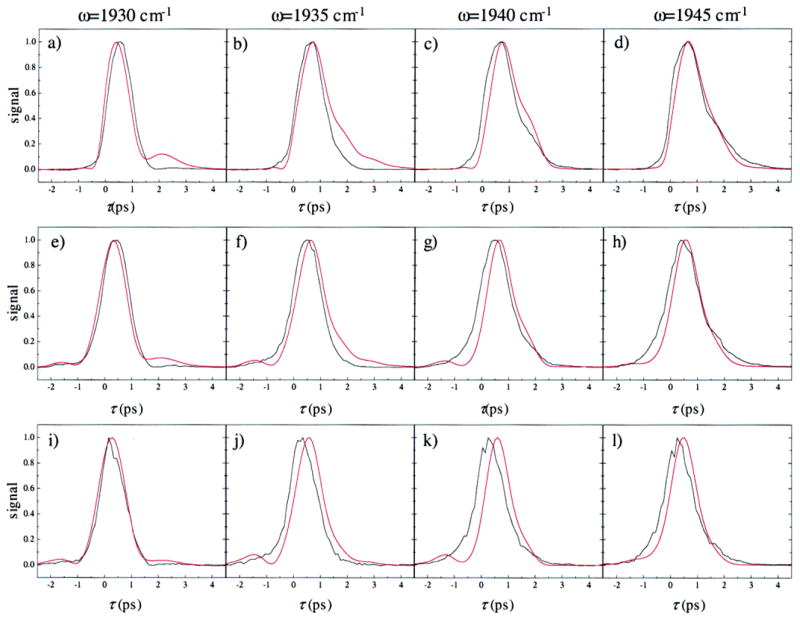
Figure 10.

Comparison of the measured vibrational echo data (black) with the calculated vibrational echo data (red) for the Nδ–H tautomer of His64. Frequencies and values of Tw are the same as those shown in Figure 8. The vibrational echo signals were calculated using the FFCFs shown in Figure 6b. The parameters used in the vibrational echo calculation are listed in Table 2. The agreement is poorer for the Nδ–H tautomer of His64 than for the Nε–H tautomer of His64 shown in Figure 8.
