
Figure 11.
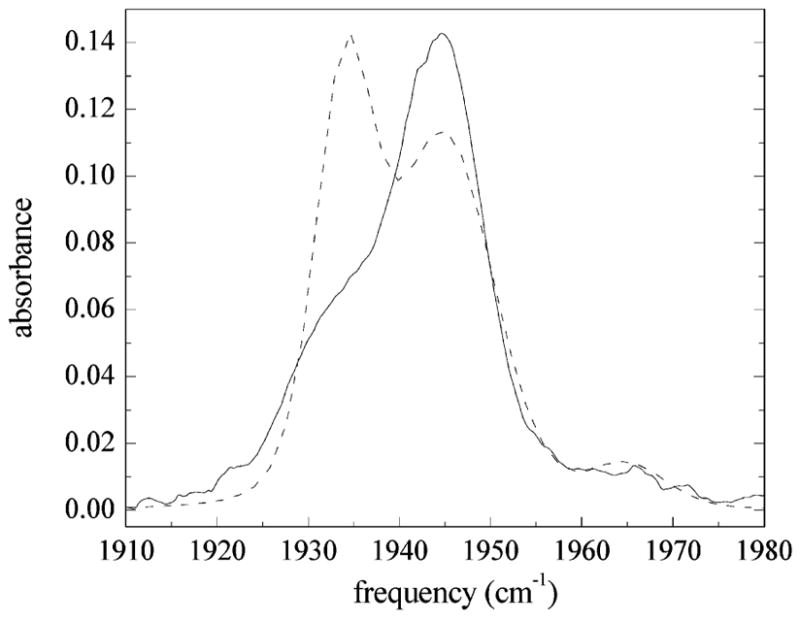
Comparison of the measured IR absorption spectrum (solid line) of the CO stretch in MbCO with that calculated using FFCFs for the Nδ–H tautomer of His64 (dashed line). The linear spectrum for the Nδ–H tautomer is calculated using the same line centers and concentrations used in the calculation of the linear spectrum for the Nε–H tautomer of His64 shown in Figure 9. The agreement between the measured and calculated linear spectrum for the Nδ–H tautomer is quite poor.