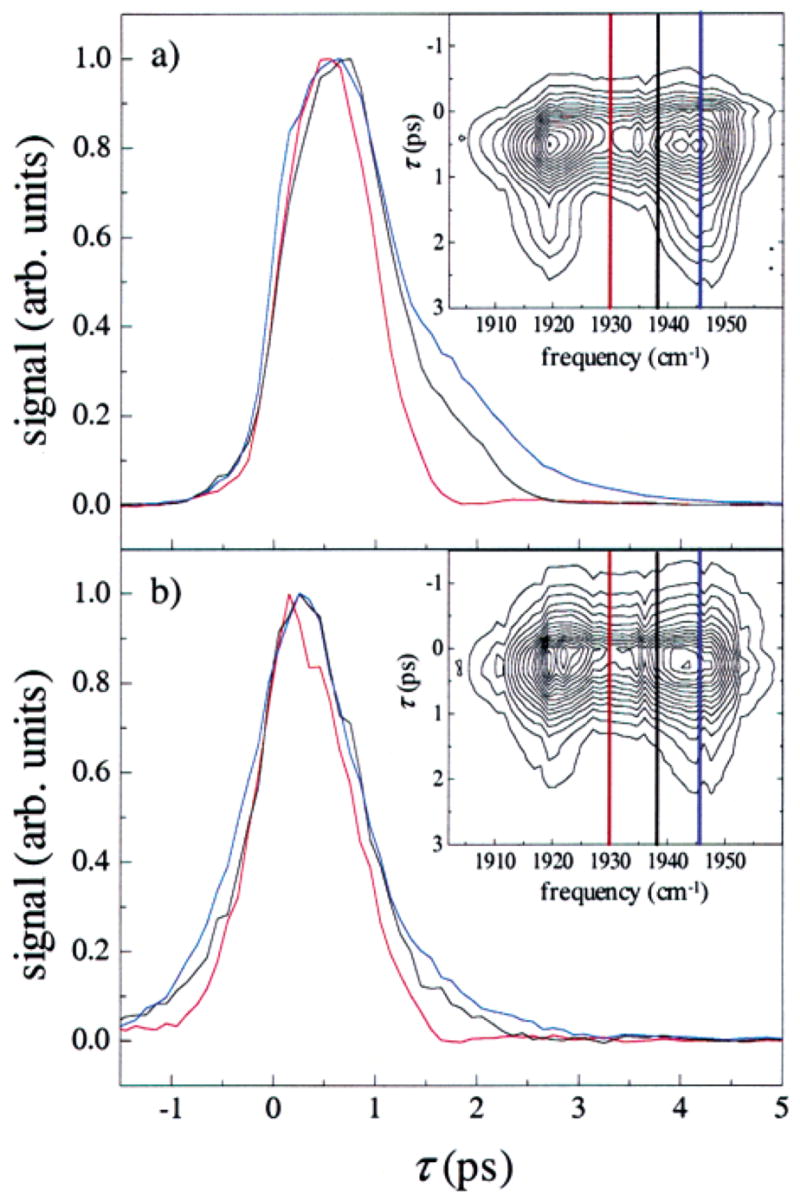
Figure 3.

Spectrally resolved stimulated vibrational echo signals for (a) Tw = 0 ps and (b) Tw = 8 ps. Slices through the vibrational echo decay data are shown in the main plots at frequencies 1946 cm−1 (blue), 1938 cm−1 (black), and 1930 cm−1 (red). The full spectral response for the two Tw values is shown in the inset, along with the frequencies of each slice. The maximum amplitude of each slice has been normalized for comparison. The vibrational echo decays are highly frequency dependent for early Tw, but become independent of frequency for long Tw. The trends shown in the data at these Tw are representative of the trends seen in the full spectrally resolved vibrational echo data at other Tw.
