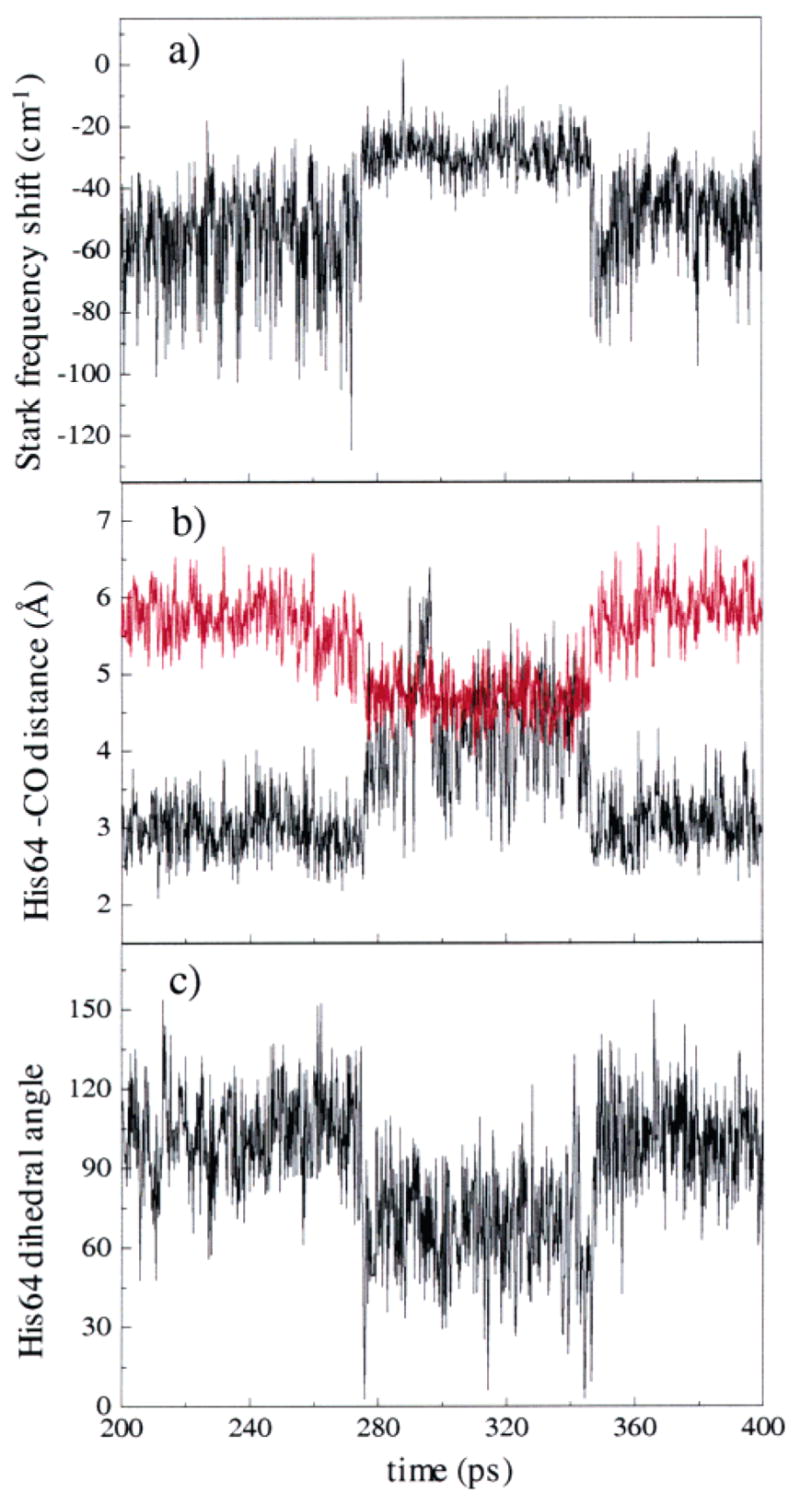
Figure 4.

An example of a MD trajectory showing the transition between the Rε state and the Bε state. A transition occurs from Rε to Bε at ~280 ps, and then back to the Rε state at ~345 ps. (a) The average value of the Stark frequency shift changes abruptly during the transition. (b) The distance between Nε–H (black) and Nδ of His64 (red) during the trajectory. In the Rε state, Nε–H is much closer to the ligand than Nδ. In the Bε state, the distances of Nε–H and Nδ of His64 to the CO are about the same. (c) The dihedral angle of the Cβ–Cδ bond changes during the transition from Rε to Bε at ~280 ps and then back at ~345 ps.
