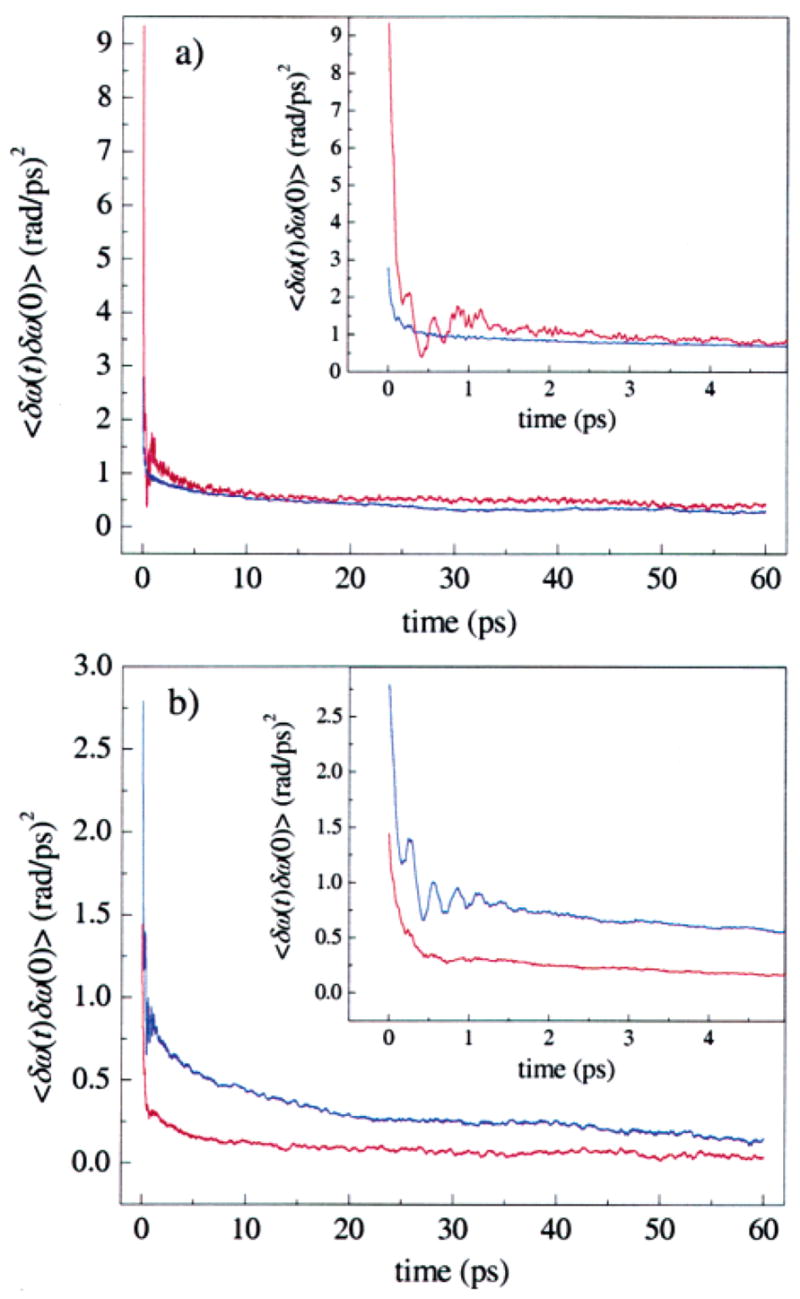
Figure 6.

Frequency–frequency correlation functions (FFCFs) for the two tautomers of MbCO derived from MD simulations used to calculate vibrational echo signals. (a) The Nε–H tautomer of His64. The Rε conformer (red) and Bε conformer (blue) both have a fast initial decay over the first few picoseconds, and then continue to decay slowly. The Rε substate has a much larger initial amplitude. The value of the Stark coupling constant λ is λ = 2.1 cm−1/(MV/cm). (b) The Nδ–H tautomer of His64. The Bδ conformer (blue) has a larger initial amplitude than the Rδ (red) conformer. The value of λ is λ = 1.4 cm−1/(MV/cm).
