
Figure 7.
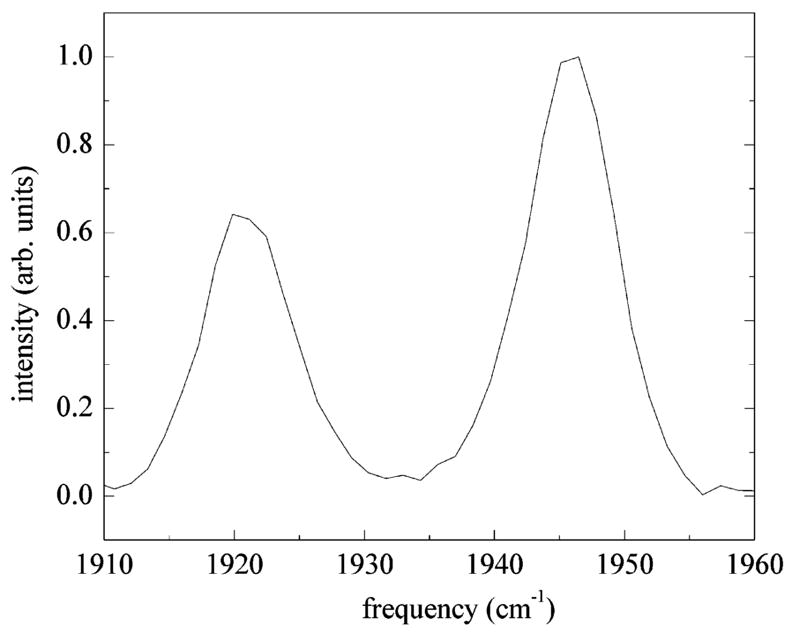
Vibrational echo spectrum at τ = 2.1 ps, Tw = 0 ps. The 0–1 and 1–2 transitions of the A1 substate are clearly seen at 1945 and 1920 cm−1. Contributions to the echo spectrum from the A3 substate have been eliminated using T2 selectivity. The splitting between the two peaks gives an anharmonicity of Δ = 25.3 cm−1.