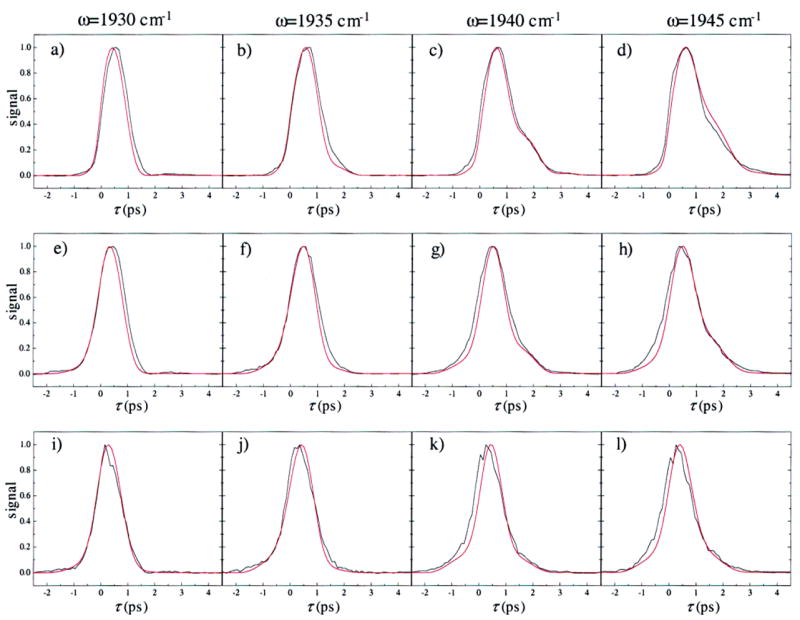
Figure 8.

Comparison of the measured vibrational echo data (black) with the calculated vibrational echo data (red) for the Nε–H tautomer of His64. The vibrational echo signals were calculated using the FFCFs shown in Figure 6a. The parameters used in the vibrational echo calculation are listed in Table 2. Spectrally resolved vibrational echo decays are shown for the frequencies 1930, 1935, 1940, and 1945 cm−1, and Tw = 0 ps (a–d), 2 ps (e–h), and 8 ps (i–l). Vibrational echo decays for a particular frequency as a function of Tw are in columns. The oscillations in the echo decays in panels c and d are due to anharmonic accidental degeneracy beats38,77,81 between the 0–1 transition of the A1 line and the 1–2 transition of the A0 line.
