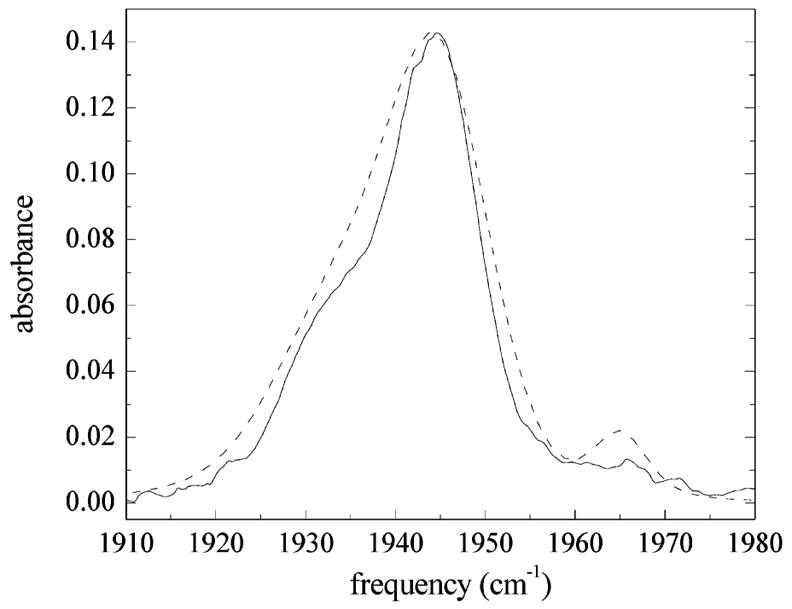
Figure 9.

Comparison of the measured IR absorption spectrum of the CO stretch in MbCO (solid line) with that calculated using FFCFs for the Nε–H tautomer of His64 (dashed line). The measured spectrum shows three bands at ~1965, 1945, and 1934 cm−1. The calculated linear spectrum for the Nε–H tautomer is slightly wider than the measured spectrum, but generally agrees reasonably well with the overall shape of the experimental spectrum.
