Figure 5.
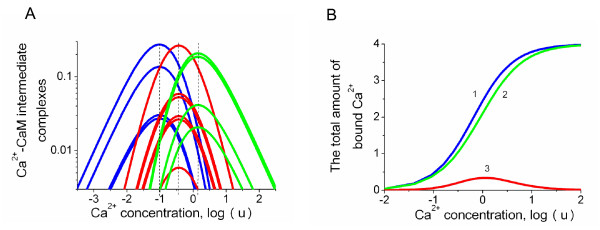
The effects of cooperative Ca2+ binding to intermediate conformations of CaM. (A) The log-log graph reveals that cooperativity slightly shifts the positions of the maximum values of the intermediate conformations. The differences in the amount of bound ligand allow quantification of the degree of cooperativity. (B) The total amount of ligand bound to CaM in the presence (1) and absence (2) of cooperative binding. The line (3) shows the difference in the level of bound ligand between the two types of binding mechanisms.

