
Figure 1.
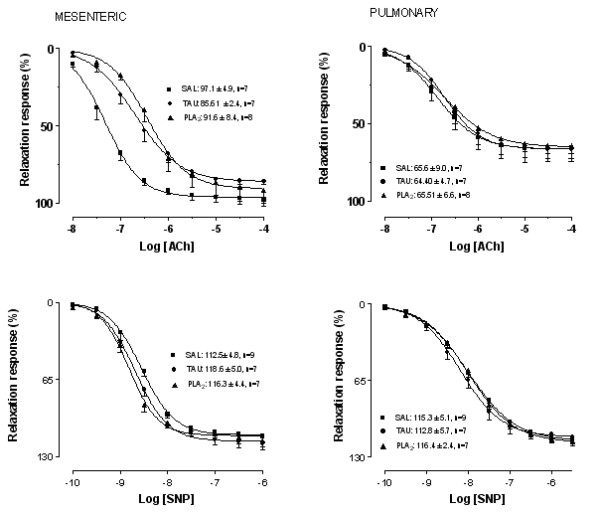
Concentration-response curves to acetylcholine (ACh, panel A) and sodium nitroprusside (SNP, panel B) in mesenteric and pulmonary rings from ■ Saline (SAL), ● taurocholate (TAU), and ▲ phospholipase A2 (PLA2). Maximal responses values were inserted in the figure. Data are mean ± SEM for 7–8 animals.