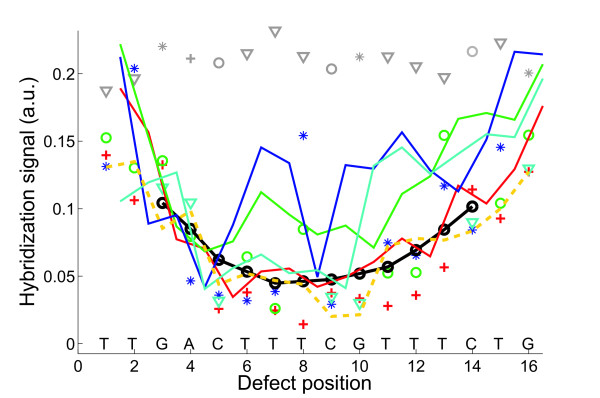
Figure 6.
Direct comparison of single base mismatches, insertions and deletions. The 16 mer probe sequence motif 3'-TTGACTTTCGTTTCTG-5' is complementary to the target BEI. Hybridization signals (data processing: raw fluorescence intensities; solution-background correction) of single base mismatch probes with substituent bases A (red crosses), C (green circles), G (blue stars), T (cyan triangles), running average of mismatch intensities (black line); perfect match probe signals (grey symbols) single base insertion probes (solid lines) with insertion bases A (red), C (green), G (blue), T (cyan). Hybridization signals of single base deletions (orange dashed line) are comparable to that of mismatches at the same position. Increased hybridization signals of certain insertion defects are due to positional degeneracy of base bulges (see discussion).

