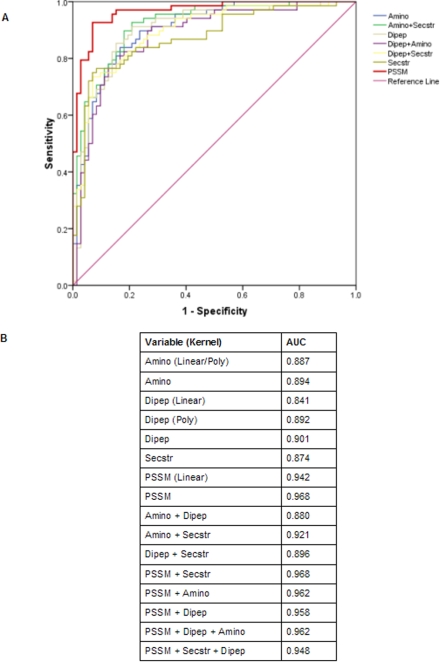
Figure 2. Threshold-independent performance of SVMs.
(A) ROC plot of SVMs based on different protein sequence features which depicts relative trade-offs between true positive and false positives. The diagonal line (line of no-discrimination) represents a completely random guess. Closer a point in the upper left corner of the ROC space, better is the prediction as it represents 100% sensitivity (when all true positives are found) and 100% specificity (when no false positives are found). The PSSM based (standalone as well as hybrids) SVM models show a similar prediction having AUC more than 95%. (B) Area under curve (AUC) obtained from the ROC plot. All SVM models are based on RBF kernel unless mentioned.

